Start: “Which records can you compare?”
Purpose: Organise supplied observations in a table/column graph, interpret zero/missing/invalid correctly and limit a conclusion.
Prepare
Read today's complete model and two contexts before the session. Paper, a pencil and the full written picture words are sufficient. Optional actual water work follows ordinary preparation; the teacher chooses suitable familiar materials/instruments. Use today's three routes without assigning a fixed learning-style label.
Run the session
-
Reconnect: say what the Day 36 plan would measure and which conditions should match. Actual incomplete runs remain incomplete.
-
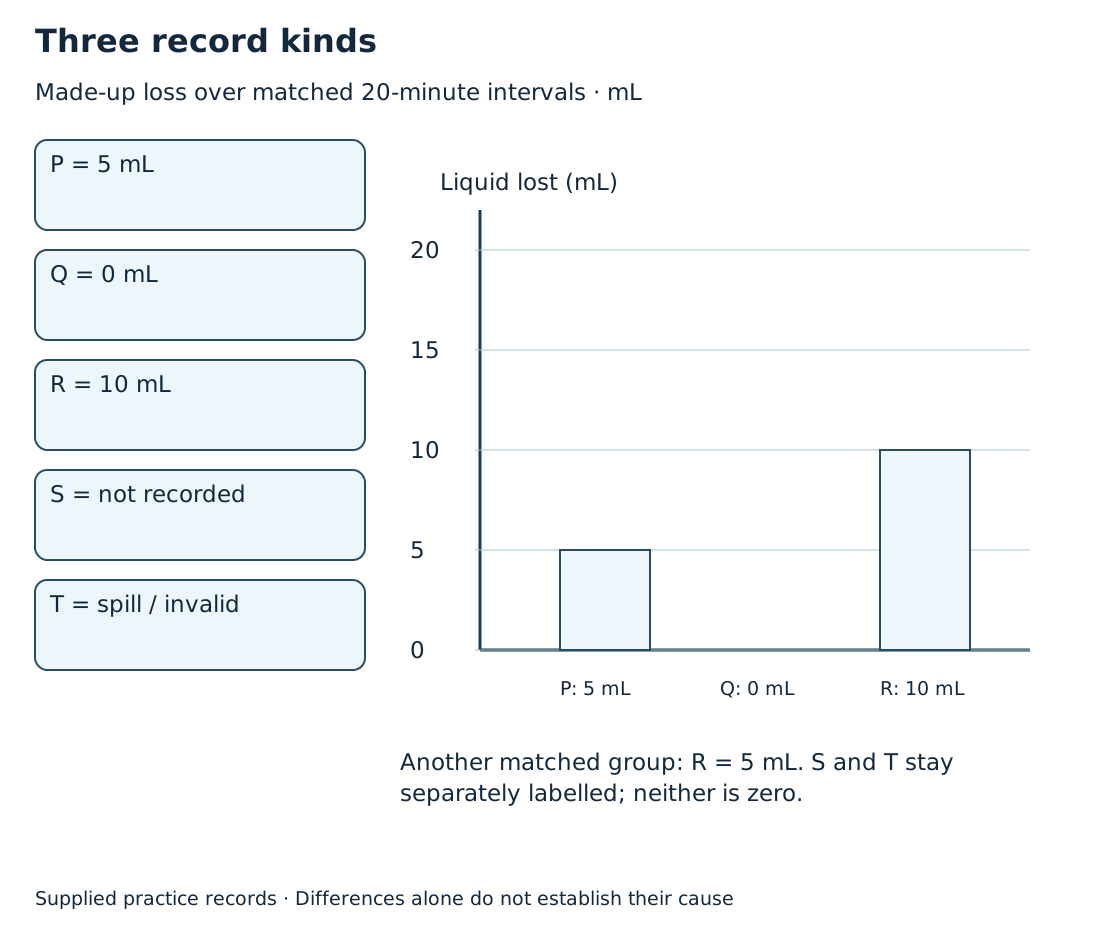
Model: teach the supplied column graph for “liquid lost over matched 20-minute runs, in mL” with categories P/Q/R and axis 0/5/10/15/20. P=5, Q=0, R=10; show Q as a labelled zero-height result. These are invented practice records.
-
Try: full supplied table adds S=blank (not recorded) and T=spill (invalid comparison). Children make the graph for P/Q/R only and keep S/T labelled separately. Do not compute zero from a blank or silently remove them from the source.
-
Compare: another supplied group's matched record is P=5,Q=0,R=5. Compare R values, ask a further question about procedure/instrument differences and distinguish possible explanation from certainty.
-
Make: complete “Among the valid records here . This does not tell us .” Teach that a zero recorded amount is not proof that no evaporation of any size occurred or that all future runs are identical.
-
Exit: a source-bound conclusion and one check/further question. Fresh C is available after this teaching, with a new record.
Three ways in
Table sorter
Sort each written record into valid value / missing / invalid; make a three-category table or dictate one.
Worked ordinary reasoning: P5,Q0,R10 are supplied values. S is missing; T had a spill and is not a fair comparison.
Column builder
Draw or use text blocks against the explicitly taught common mL axis; label a zero with words rather than a hidden empty bar.
Worked ordinary reasoning: R10 is the tallest shown bar; Q0 is a real supplied zero; the graph excludes neither the existence nor the labels of S/T.
Comparison editor
Use two whole supplied tables and repair “R always loses 10 mL”. Choose a cautious claim and a next question.
Worked ordinary reasoning: This table shows R10; another matched record shows R5. I would ask how each reading and matched condition was checked.
Look and choose the next teaching
Correct labels/units and source-bound comparison; no extrapolation to local weather or all trays.
If blank becomes zero, use three distinct written cards before graphing a new supplied record.
Today's complete resources
A12 · whole labelled picture · Complete terms · A12 · complete picture words
Short child start · Written read-aloud · Water Trail and paper
Partial opportunities: AC9S4I04, AC9S4I05, AC9S4H01 · Full mapping and limits