The original A4 landscape chart has four rows of ten equal cells. Read each row left to right:
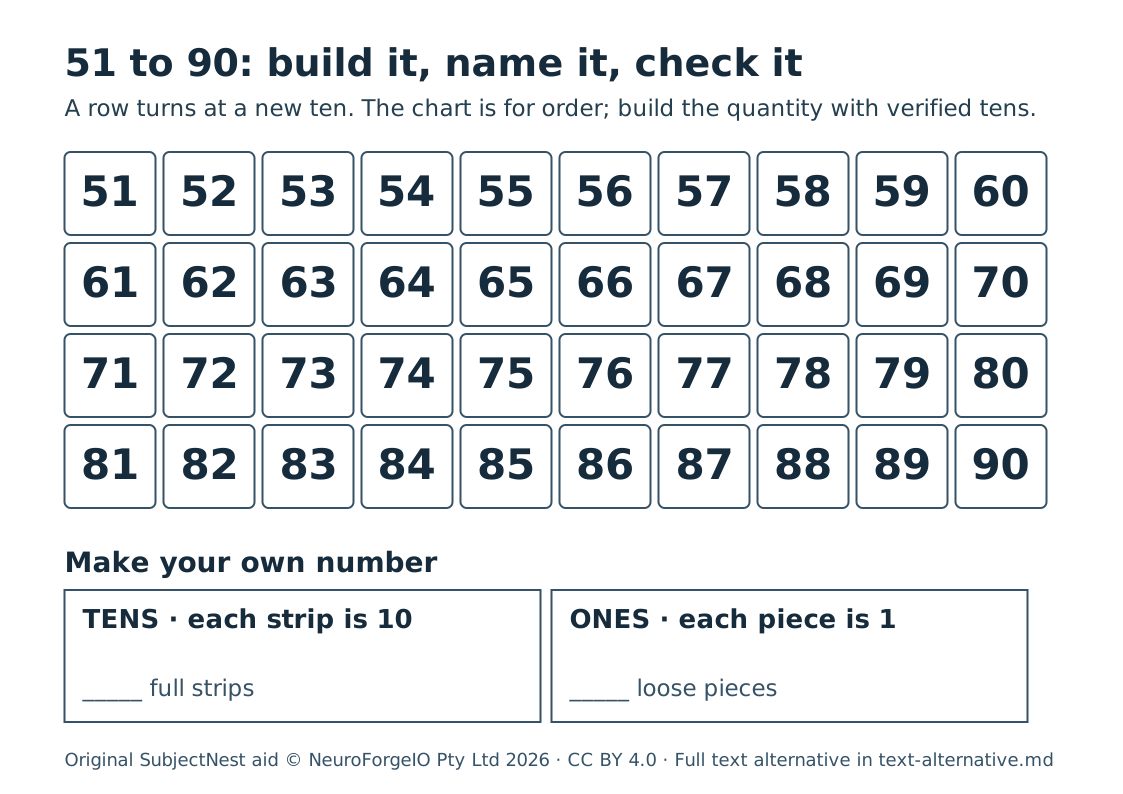
51 52 53 54 55 56 57 58 59 60
61 62 63 64 65 66 67 68 69 70
71 72 73 74 75 76 77 78 79 80
81 82 83 84 85 86 87 88 89 90
Each row ends at a new full ten. It is a chart, not one straight equally spaced number line: the visual jump from the end of one row to the start of the next is a layout change, while the count still increases by one. A teacher may cut the rows into a joined 51–90 strip or provide tactile large-number cards in that order. Do not infer a learner understands quantity merely because they find a printed cell.
Under the chart is a blank two-column mat: TENS · each full strip is 10 and ONES · each loose piece is 1. A learner can place strips/counters, draw grouped marks, type a tens-and-ones list or direct an adult. Check one strip has ten cells before treating it as a ten. For 69 + 1, first keep six strips and ten ones, then trade the ten loose pieces for a seventh strip; both models show 70.
The SVG uses dark text on white cells and explicit words as well as borders; no colour identifies a quantity. It has a title and description for assistive technology. There are no photos, recorded voices or third-party fonts embedded.
Rights: Original chart and text © NeuroForgeIO Pty Ltd 2026, CC BY 4.0.