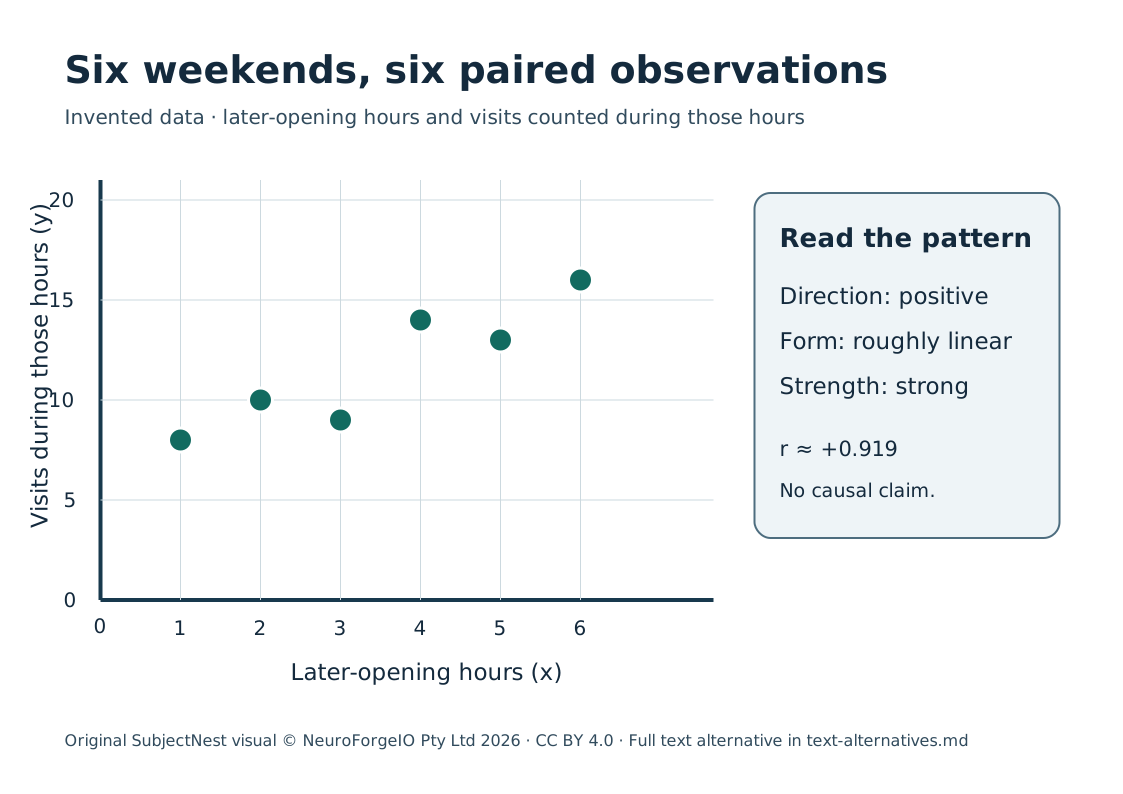
Success: Describe Card B's association by direction, form and strength, with a data qualification.
- Notice · 3 min. Use the plots learners made on Day 6 or the ordered coordinate list in their data card. Do higher x values generally pair with higher y? Keep the annotated teacher display covered until learners have recorded their own direction, form and strength.
- Model · 5 min. Say “positive” for upward tendency, “roughly linear” for a cloud near a straight line, and “strong” for tight clustering. These are different features.
- Try · 6 min. Learners write one phrase for each feature, then circle the point (3,9) to see that not every step increases.
- Compare · 5 min. Discuss why “perfect positive” is false: from (2,10) to (3,9), y falls. Do not connect the points as a time series for this question.
- Transfer · 4 min. Ask whether “longer hours cause more reading” follows. The invented weekends do not measure reading and differ in possible other conditions.
- Exit · 2 min. Collect direction/form/strength plus a cautious contextual phrase. Teach the missing descriptor next.