Each session is 25 minutes: 3 + 5 + 6 + 5 + 4 + 2. Use the learner cards, visuals and text alternatives, practice checks and teacher key. These are introductory slices of the syllabus's notional 11 hours for the two Topic 1 sub-topics, not a completed topic.
Day 1 — Two variables, one visit
Success: Identify the two categorical variables and the observational unit in Card A.
- Notice · 3 min. Ask whether “morning” and “quiet” describe one or two visits when written on one record card. Let students hold a two-label mock card.
- Model · 5 min. Define bivariate data as paired values for two variables on each unit. Point to a hypothetical visit with session = morning and choice = quiet.
- Try · 6 min. Learners label Card A's variables, their categories and what the table counts. They state why “visit” need not mean “different person”.
- Compare · 5 min. Read the 12 cell aloud as “12 morning visits used a quiet table”. Contrast with the false reading “12 people always chose quiet”.
- Transfer · 4 min. Students invent two categorical variables for a fictional museum or sports club and name the unit to be counted; no personal survey.
- Exit · 2 min. Collect the variables and unit for Card A. If a learner says “number of people”, use repeat-visit cards tomorrow.
Day 2 — Totals must agree
Success: Complete row, column and grand totals and cross-check them two ways.
- Notice · 3 min. Display Card A with question marks. Ask which sums should agree at the bottom-right cell.
- Model · 5 min. Complete morning 12 + 8 = 20. Say “row total is visits in this session, across both choices”.
- Try · 6 min. Learners complete afternoon, quiet and group totals independently, with counters or a table reader if helpful.
- Compare · 5 min. Add row totals and column totals separately. Both must give 40; diagnose a deliberate incorrect bottom-right 42.
- Transfer · 4 min. Ask which total answers “all quiet-table visits” and which answers “all afternoon visits”, with labels.
- Exit · 2 min. Collect completed four cells and one cross-check. Reteach row/column orientation if either total differs.
Day 3 — The denominator changes the question
Success: Calculate row percentages for quiet-table choice in each session and state the comparison base.
- Notice · 3 min. Offer 12/20, 12/18 and 12/40. Which answers “of morning visits, what share chose quiet?”
- Model · 5 min. Compute 12 ÷ 20 × 100 = 60%. Read it as “60% of morning visits”, not “60% of everyone”.
- Try · 6 min. Learners calculate afternoon quiet and both group percentages. Allow a calculator while still writing numerators/denominators.
- Compare · 5 min. Each row must total 100%. Morning 60/40; afternoon 30/70. Ask why column percentages would answer a different question.
- Transfer · 4 min. Students say the quiet comparison in one precise sentence with counts and percentages, with written/AAC option.
- Exit · 2 min. Ask whether “18 of 40 quiet” answers the within-session question. Expected: no; it answers share of all visits.
Day 4 — Association, with a boundary
Success: Describe a categorical association as different within-session percentages without claiming causation.
- Notice · 3 min. Show 60% morning and 30% afternoon for quiet choice. What changed across session categories?
- Model · 5 min. State “In this invented table, quiet choice is 30 percentage points more common among morning visits.” Explain percentage points, not “30% more”.
- Try · 6 min. Learners make a one-sentence association claim and a separate sentence identifying the compared rows.
- Compare · 5 min. Ask whether time caused the choice. Possible differences include which visits were recorded; data alone cannot decide. Avoid asserting a particular explanation is true.
- Transfer · 4 min. Students critique “Afternoons make visitors sociable” using one data fact and one limitation.
- Exit · 2 min. Collect a 60-versus-30 statement with denominator and a non-causal boundary. If the denominator is missing, practise “of each row” tomorrow.
Day 5 — Fresh categorical transfer
Success: Choose the correct row denominator and interpret association in a new invented table.
- Notice · 3 min. Give Check 1 from student assessment: invitation channel versus trial attendance.
- Model · 5 min. Model only the row-percentage method with an unrelated two-cell example, 2/5 = 40%, then remove it. Do not work the Check 1 table aloud.
- Try · 6 min. Learners complete totals and row percentages independently. Record calculator/support use.
- Compare · 5 min. Students write a contextual comparison and a sentence about why invitation method is not proven causal.
- Transfer · 4 min. Ask which additional information about how invitees were selected would make the comparison easier to judge.
- Exit · 2 min. Save first responses and use the keyed rubric for a reteach decision; this is not a QCAA IA score.
Day 6 — Make the pair visible
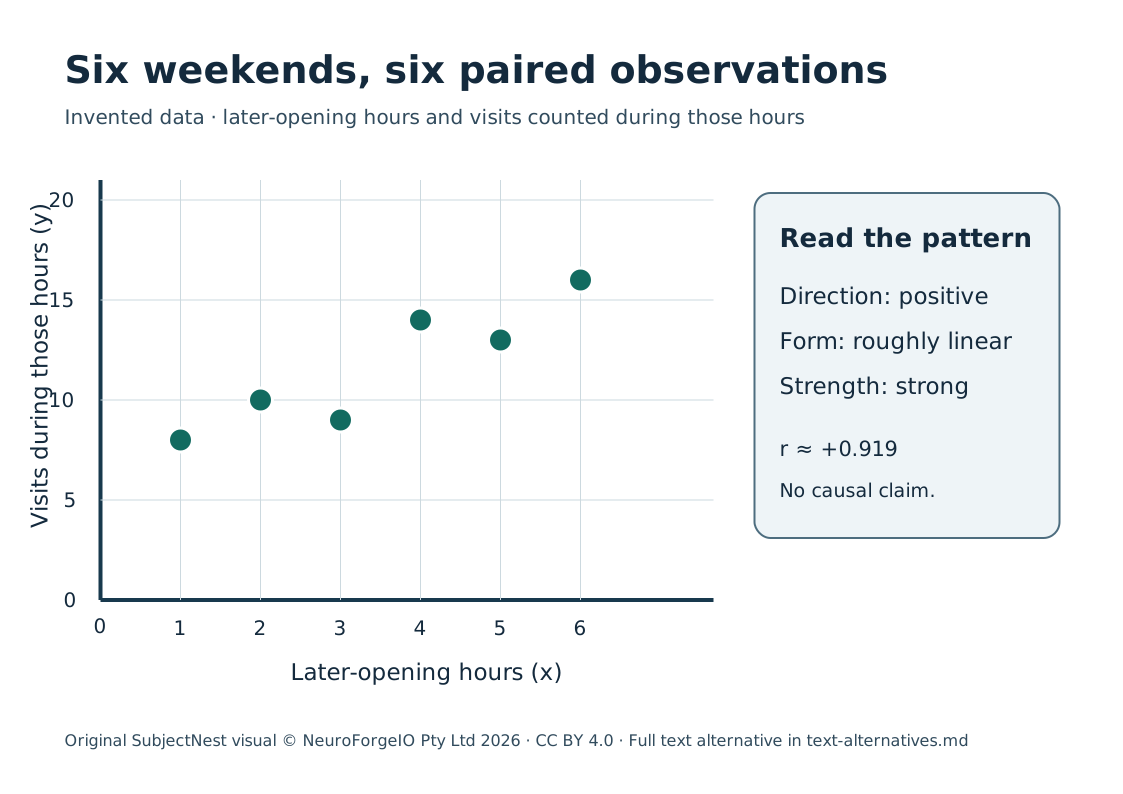
Success: Identify explanatory and response variables on Card B and plot all six pairs with labelled axes.
- Notice · 3 min. Hold up “hours = 3, visits = 9”. Ask how many dots that pair makes. Exactly one.
- Model · 5 min. Put hours on horizontal x and visits on vertical y; label units and plot (1,8). Explain that choosing explanatory x is a modelling choice, not proof of cause.
- Try · 6 min. Learners plot or tactile-place the remaining five coordinates from Card B. A screen-reader learner may work from the ordered coordinate list in the text alternative.
- Compare · 5 min. Cross-check the six points against the table: (2,10), (3,9), (4,14), (5,13), (6,16). A graph with joined lines would imply continuity not shown by six weekends.
- Transfer · 4 min. Ask what “visits during those hours” leaves out, including different exposure times and other weekend conditions.
- Exit · 2 min. Collect axis labels and one correct coordinate; reteach a reversed-axis error before Day 7.
Day 7 — Three words for a cloud
Success: Describe Card B's association by direction, form and strength, with a data qualification.
- Notice · 3 min. Use the plots learners made on Day 6 or the ordered coordinate list in their data card. Do higher x values generally pair with higher y? Keep the annotated teacher display covered until learners have recorded their own direction, form and strength.
- Model · 5 min. Say “positive” for upward tendency, “roughly linear” for a cloud near a straight line, and “strong” for tight clustering. These are different features.
- Try · 6 min. Learners write one phrase for each feature, then circle the point (3,9) to see that not every step increases.
- Compare · 5 min. Discuss why “perfect positive” is false: from (2,10) to (3,9), y falls. Do not connect the points as a time series for this question.
- Transfer · 4 min. Ask whether “longer hours cause more reading” follows. The invented weekends do not measure reading and differ in possible other conditions.
- Exit · 2 min. Collect direction/form/strength plus a cautious contextual phrase. Teach the missing descriptor next.
Day 8 — Technology gives a number, not a story
Success: Calculate Pearson's r with approved technology and interpret its sign, size and linear scope.
- Notice · 3 min. Predict whether r is positive, negative or near zero from the plot before opening a spreadsheet.
- Model · 5 min. Enter x and y from Card B in two columns; demonstrate
=CORREL(B2:B7,C2:C7)when those are the actual ranges. Show the cell/range check and the result to four decimals. - Try · 6 min. Learners reproduce the calculation on school-approved technology, or inspect a supplied result if equipment is unavailable. Log which route was used.
- Compare · 5 min. Expected r ≈ +0.9189. It supports a strong positive linear association for these six pairs. It does not measure a causal effect.
- Transfer · 4 min. Ask what the result would mean if the columns were reversed. r would be unchanged, even though explanatory and response labels matter for the question.
- Exit · 2 min. Collect value, sign and contextual interpretation. If technology gives an error, inspect header rows and paired ranges before teaching meaning.
Day 9 — What R² can and cannot say
Success: Square r and interpret R² as a descriptive measure of a straight-line fit for the observed pairs.
- Notice · 3 min. Ask why squaring +0.9189 cannot tell the direction on its own.
- Model · 5 min. Compute R² ≈ 0.8444 using unrounded r where possible, then convert to about 84.4%.
- Try · 6 min. Learners use their technology output to calculate the square; compare rounding differences. Provide the precomputed r only if needed and record that support.
- Compare · 5 min. Say “About 84.4% of the observed variation in visit counts is accounted for by a straight-line relation with trial hours in these six invented pairs.” Reject “84.4% of visits are caused by hours.”
- Transfer · 4 min. Students identify one unmeasured factor, such as publicity or weather, as a possible alternative, without asserting it occurred.
- Exit · 2 min. Collect R² and one bounded sentence. If a learner gives 0.9189 as R², revisit square versus input.
Day 10 — New pairs, same reasoning
Success: Transfer graphing, r, R² and a non-causal limit to a fresh invented dataset.
- Notice · 3 min. Distribute fresh Card C with Check 2 from student assessment; no answer display.
- Model · 5 min. Remind learners of the checklist only: axes, direction/form/strength, technology range, interpretation, limit. Do not use Card C numbers in the model.
- Try · 6 min. Learners plot or inspect coordinates, calculate with school-approved technology, and complete the check independently with logged supports.
- Compare · 5 min. After saving the first response, let learners peer-check paired ranges and units. A changed answer is saved as revision, not replacing first evidence.
- Transfer · 4 min. Ask for one sentence that would be safe to include in a public pilot report and one sentence that would overclaim causation.
- Exit · 2 min. Use the teacher key's exact result and dimension-specific next moves to form the next teaching groups. Do not use this as an IA result.
Rights: Original scripts © NeuroForgeIO Pty Ltd 2026, CC BY 4.0.