Success: connect a table to a coordinate graph while respecting whole-number domain. (AC9M8A02, AC9M8A03)
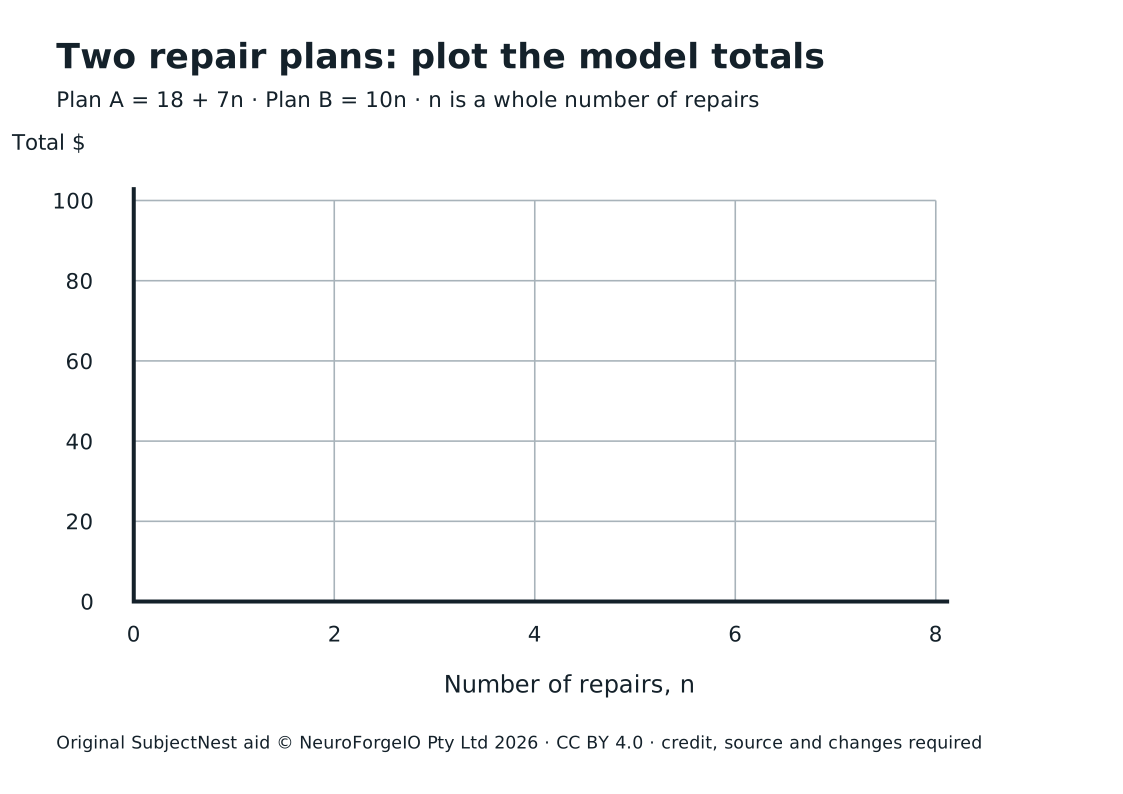
- Orient · 2 min. On print axes, x is number of repairs and y is total dollars; ask what
(2,32)means. - Model · 4 min. Plot A's
(0,18),(2,32),(4,46)and B's(0,0),(2,20),(4,40). - Guided extend · 5 min. Plot both at
n=6andn=8. Locate meeting(6,60). - Independent statement · 7 min. Learners write one sentence about slope per repair and one about intercept. A increases $7 per repair from $18; B increases $10 from $0.
- Domain check · 4 min. If lines are drawn to show trend, circle integer x-values as actual cases. Ask why
n=4.5is not a possible repair count here. - Exit · 3 min. “What does
(6,60)mean?” Key: six repairs cost $60 under either supplied model.