Use fictional number cards, graph, sample grid and keys. Every lesson has 2 + 4 + 5 + 7 + 4 + 3 = 25 minutes. Maths may be shown with an equation, table, tactile tokens, graph, calculator/spreadsheet or spoken argument; record the route. Selected partial codes: AC9M8A01, AC9M8A02, AC9M8A03, AC9M8ST01, AC9M8ST02, AC9M8ST03, AC9M8ST04.
Day 1 — Name the variable before calculating
Success: express a fixed-plus-variable cost and state a sensible domain. (AC9M8A01, AC9M8A03)
- Read · 2 min. Show Plan A's $18 joining cost and $7 per repair. Ask which cost changes when repairs change.
- Model · 4 min. Let
nbe repairs. WriteA(n)=18+7n. The 18 is fixed, the 7 multiplies the number of repairs;n=0,1,2…, not negative or half a repair. - Guided build · 5 min. Learners form
B(n)=10nfrom Plan B's no-joining-cost card. Substituten=2: A=$32, B=$20. - Independent turn · 7 min. For
n=3, learners compute A=$39, B=$30 and write what each term means. Paper, tokens, speech or keyboard accepted. - Error check · 4 min. Repair
18n+7by testing zero repairs: the incorrect expression yields $7, whereas the joining fee alone would be $18. - Exit · 3 min. “What does 7 represent in A?” Key: $7 for each repair, not $7 fixed joining cost.
Day 2 — A table is a model, not a quotation
Success: calculate a table and identify what the model omits. (AC9M8A03)
- Recall · 2 min. Ask for A and B at zero repairs: $18 and $0.
- Model · 4 min. Fill
n=2andn=4: A $32/$46, B $20/$40; use substitution so each entry can be checked. - Guided finish · 5 min. Class completes
n=6: both $60. Ask why equality at one count does not make all counts equal. - Independent table · 7 min. Learners fill
n=8: A $74, B $80, then compare atn=0,2,4,6,8in a sentence. - Assumption scan · 4 min. Circle omitted parts/quality/travel/eligibility. A correct model answer is not a real cheapest purchase claim.
- Exit · 3 min. “At eight repairs, which model total is lower and by how much?” Key: A by $6.
Day 3 — Plot the possible counts
Success: connect a table to a coordinate graph while respecting whole-number domain. (AC9M8A02, AC9M8A03)
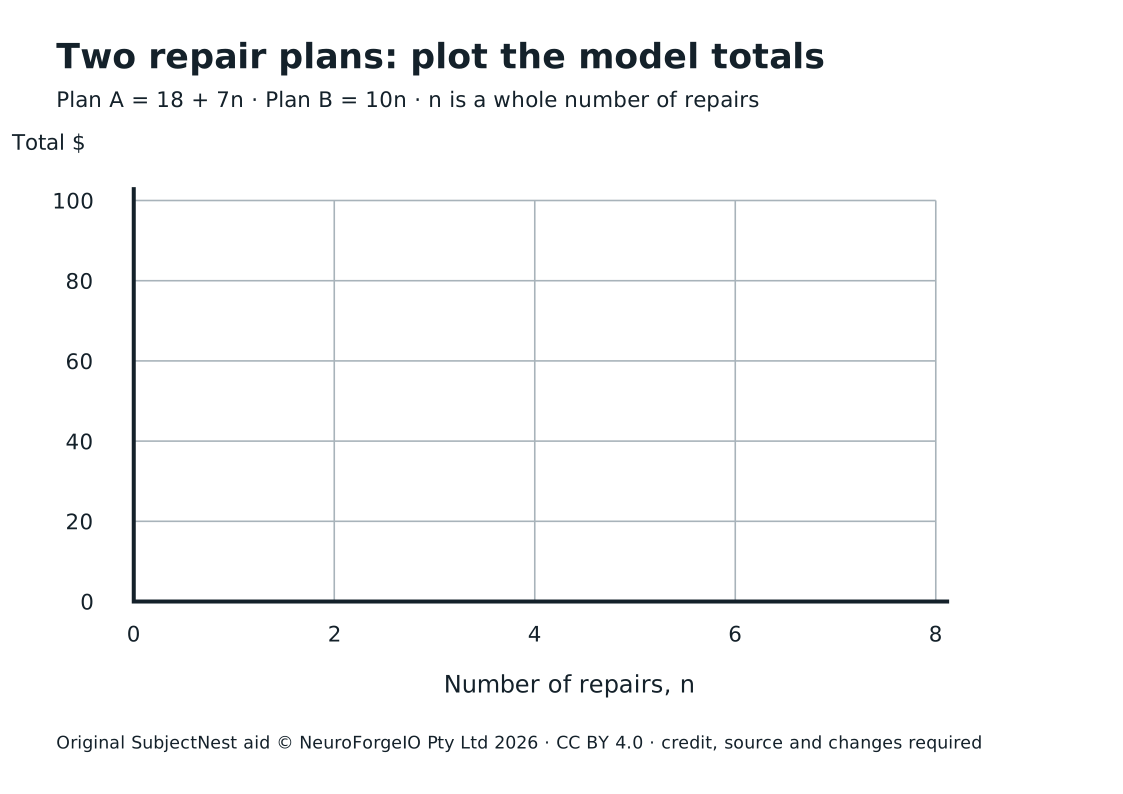
- Orient · 2 min. On print axes, x is number of repairs and y is total dollars; ask what
(2,32)means. - Model · 4 min. Plot A's
(0,18),(2,32),(4,46)and B's(0,0),(2,20),(4,40). - Guided extend · 5 min. Plot both at
n=6andn=8. Locate meeting(6,60). - Independent statement · 7 min. Learners write one sentence about slope per repair and one about intercept. A increases $7 per repair from $18; B increases $10 from $0.
- Domain check · 4 min. If lines are drawn to show trend, circle integer x-values as actual cases. Ask why
n=4.5is not a possible repair count here. - Exit · 3 min. “What does
(6,60)mean?” Key: six repairs cost $60 under either supplied model.
Day 4 — Solve, then substitute
Success: solve the equality and verify it in both formulas. (AC9M8A01, AC9M8A02)
- Question · 2 min. Ask which
nmakes totals equal, without pointing to graph first. - Model · 4 min. Write
18+7n=10n, subtract7nfrom both sides to get18=3n. - Guided finish · 5 min. Divide by 3:
n=6. Substitute: A18+42=60, B60. - Independent compare · 7 min. Learners choose
n=5andn=7to show direction changes: at 5, A=$53/B=$50; at 7, A=$67/B=$70. - Method compare · 4 min. Table, graph and algebra agree on six. Ask which one best exposes the exact equality and why.
- Exit · 3 min. “Is A lower at five?” Key: no, A=$53, B=$50.
Day 5 — Fresh linear check A
Success: model and compare a new fixed-plus-variable pair independently. Prepare art-studio card. (AC9M8A01, AC9M8A02, AC9M8A03)
- Set · 2 min. State that fictional visits are whole, non-negative numbers; no real fee is being quoted.
- Clarify · 4 min. Read only the new conditions: C $12 plus $5 per visit; D $8 per visit. Do not model the equation.
- Plan · 5 min. Learners choose table, graph or equation, with enough room to show work.
- Independent response · 7 min. Find formulas, equality point and which plan is lower at three and six visits.
- Self-check · 4 min. Substitute the meeting value into both; check a count on each side. Record any revision separately.
- Exit · 3 min. Submit exact work. Key:
v=4, $32 each; at 3 D lower, at 6 C lower.
Day 6 — Who is the population?
Success: distinguish a full group from a sample and note practical/ethical limits. (AC9M8ST01, AC9M8ST04)
- Frame · 2 min. Read fictional question: “What travel modes occur in the imagined 100-student population?” No real classmates are surveyed.
- Model · 4 min. Define population 100, census all 100, sample fewer. A census gives full counts in this model but can be costly or intrusive in a real school.
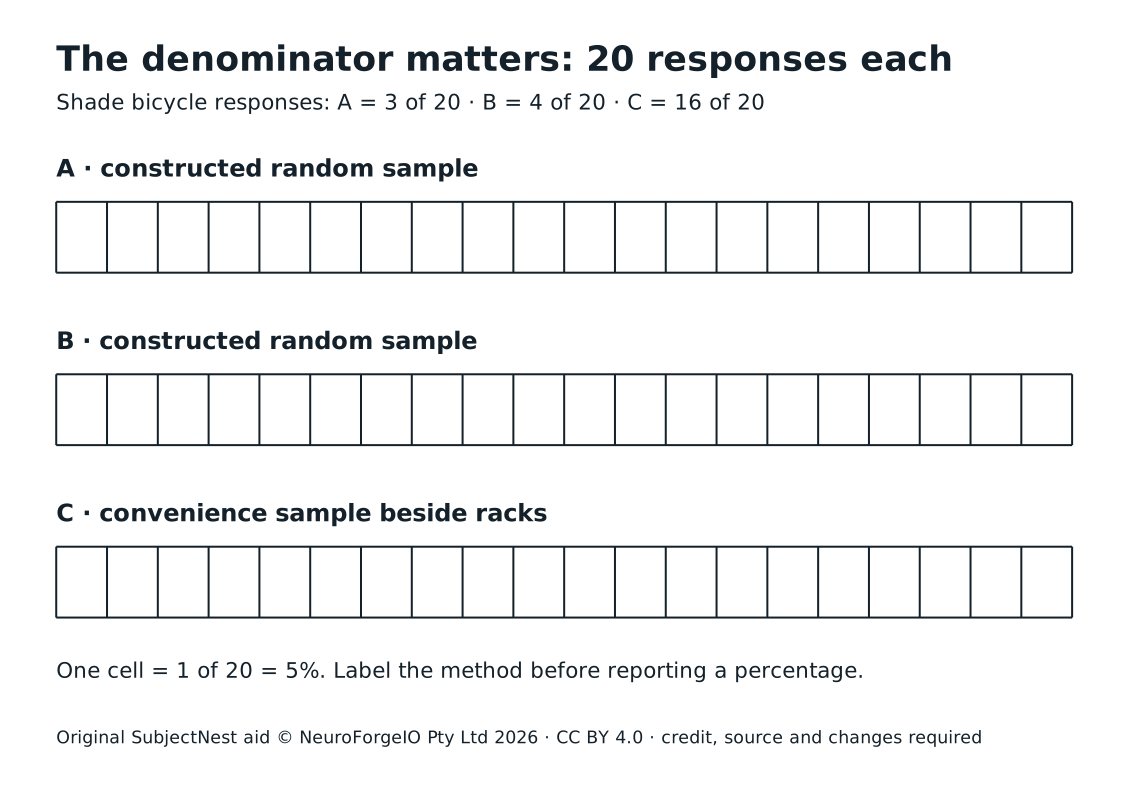
- Guided classify · 5 min. Learners label A/B as constructed simple random samples of 20 and C as convenience sample of 20 by racks.
- Independent plan · 7 min. Write a way to select 20 from numbered fictional cards giving each one a known equal chance, without replacing selected cards. State one privacy question a real survey would need to resolve.
- Peer audit · 4 min. Partner checks whether selection location favours a mode and whether all 100 could be reached by the proposed method.
- Exit · 3 min. “Does 20 responses automatically mean a fair sample?” Key: no; how people were selected matters.
Day 7 — Same size, different results
Success: calculate proportions and describe variation between two same-size model random samples. (AC9M8ST02, AC9M8ST03)
- Recall · 2 min. Both A and B have 20 responses. Ask whether identical size requires identical counts.
- Model · 4 min. Bicycle share A is
3/20=15%; B is4/20=20%. - Guided table · 5 min. Compute bus shares A
7/20=35%, B5/20=25%; ask which category changed more in percentage points. - Independent comparison · 7 min. Learners choose walk/roll or other, compute both shares, and say why two model samples can differ even when each uses a fair chance process.
- Visual check · 4 min. Show 20-cell grids or tactile tokens for each sample; prevent a 5-percentage-point difference being mistaken for five people.
- Exit · 3 min. “How many percentage points apart are bicycle shares A and B?” Key: 5 points, one person out of 20.
Day 8 — The location changed the answer
Success: critique a convenience sample without calling its arithmetic wrong. (AC9M8ST01, AC9M8ST02, AC9M8ST04)
- See · 2 min. Display rack C: 16 bicycles out of 20; ask for its sample percentage.
- Model · 4 min.
16/20=80%, which is correct for C. Because selection was beside racks, it may overrepresent cyclists; it cannot estimate all students well. - Guided compare · 5 min. Contrast C's 80%, random model A's 15%, B's 20% and known fictional population's 20%. Ask which source answers each narrower question.
- Independent critique · 7 min. Learners write a two-line correction to “80% of all students cycle”: valid sample result plus uncertainty about population.
- Fairness talk · 4 min. Ask why a shelter decision based on the rack sample could overlook bus users. Do not ask anyone to disclose their own travel.
- Exit · 3 min. “What is wrong:
16/20=80%or calling that 80% of all students?” Key: the population inference.
Day 9 — Report uncertainty, not a fake certainty
Success: make an inference limited by how the sample was chosen. (AC9M8ST03, AC9M8ST04)
- Recall · 2 min. Ask why A and B's bicycle proportions differ by one person even though both have 20.
- Model · 4 min. Say: “In these two simulated random samples, bicycle estimates were 15% and 20%; another fair sample could differ too.” Show the optional repeated simulation: across 1000 seeds, the average error was 8.95 percentage points for samples of 10 and 3.92 for samples of 40. Do not claim every larger sample must be closer.
- Guided claim test · 5 min. Sort “sample A had 3 cyclists” as direct model fact; “all students cycle at 15%” as overreach; “larger fair samples often vary less, but do not guarantee exactness” as a qualified pattern.
- Independent brief · 7 min. Learners draft three sentences for a fictional principal: two source figures, one method limitation and one ethical next action. A source label must accompany each number.
- Peer check · 4 min. Partner asks how a simple random sample would be drawn and whether a census is necessary or appropriate.
- Exit · 3 min. “Can two equal-size random samples give different percentages?” Key: yes; this model has 15% and 20% bicycle.
Day 10 — Fresh sample check B
Success: independently analyse a new sampling claim and propose a fairer response. Prepare arts-club card. (AC9M8ST01, AC9M8ST02, AC9M8ST03, AC9M8ST04)
- Set · 2 min. Clarify fictional status and that no learner interest is being asked.
- Read · 4 min. Give the 100-person model population and three 20-person samples. Do not name the likely biased sample.
- Plan · 5 min. Learners decide how to compare percentages, selection method and the claim's reach.
- Independent work · 7 min. Compute shares, identify sampling concern and write a bounded population statement.
- Check · 4 min. Multiply or divide to confirm each fraction; label percentages as model sample or known model population.
- Exit · 3 min. “Why not use the music-club meeting to speak for all 100?” Key: people there are more likely to be interested. Use rubric/key.
Rights: Original lesson prose © NeuroForgeIO Pty Ltd 2026, SubjectNest, CC BY 4.0; credit, link and indicate changes.