The SVG and PDF versions of each aid print on A4. Full text below supplies reading order without relying on hue, line shape or spatial vision. The teacher can copy each labelled item onto separate index cards, braille labels or raised-line rectangles and place them in the indicated order. A tactile card activity preserves coordinate and category claims; it is not a decorative substitute. The PDFs are selectable-text untagged, so this page is the deliberate screen-reader alternative. All four diagrams refer to invented practice data and cannot guide actual emergency decisions.
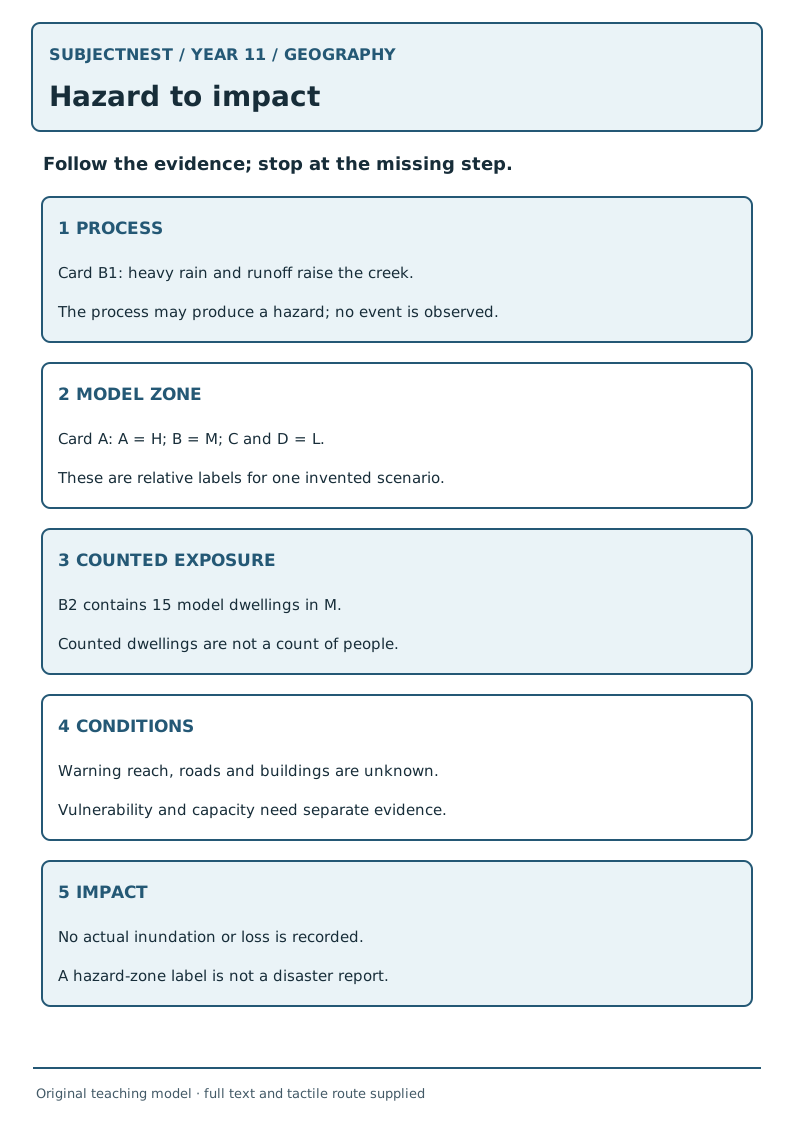
Hazard to impact
SVG · PDF. Reading order: 1 Process — Card B1: heavy rain and runoff raise the creek; no event is observed. 2 Model zone — Card A: A=H, B=M, C and D=L; relative labels for one invented scenario. 3 Counted exposure — B2 contains 15 model dwellings in M, not 15 people. 4 Conditions — warning reach, roads and buildings are unknown; vulnerability and capacity require evidence. 5 Impact — no actual inundation or loss is recorded; a hazard-zone label is not a disaster report. Tactile route: build five numbered, full-word horizontal strips in order. The learner physically inserts an “unknown” strip between exposure and impact, and says why a conclusion cannot cross that gap.
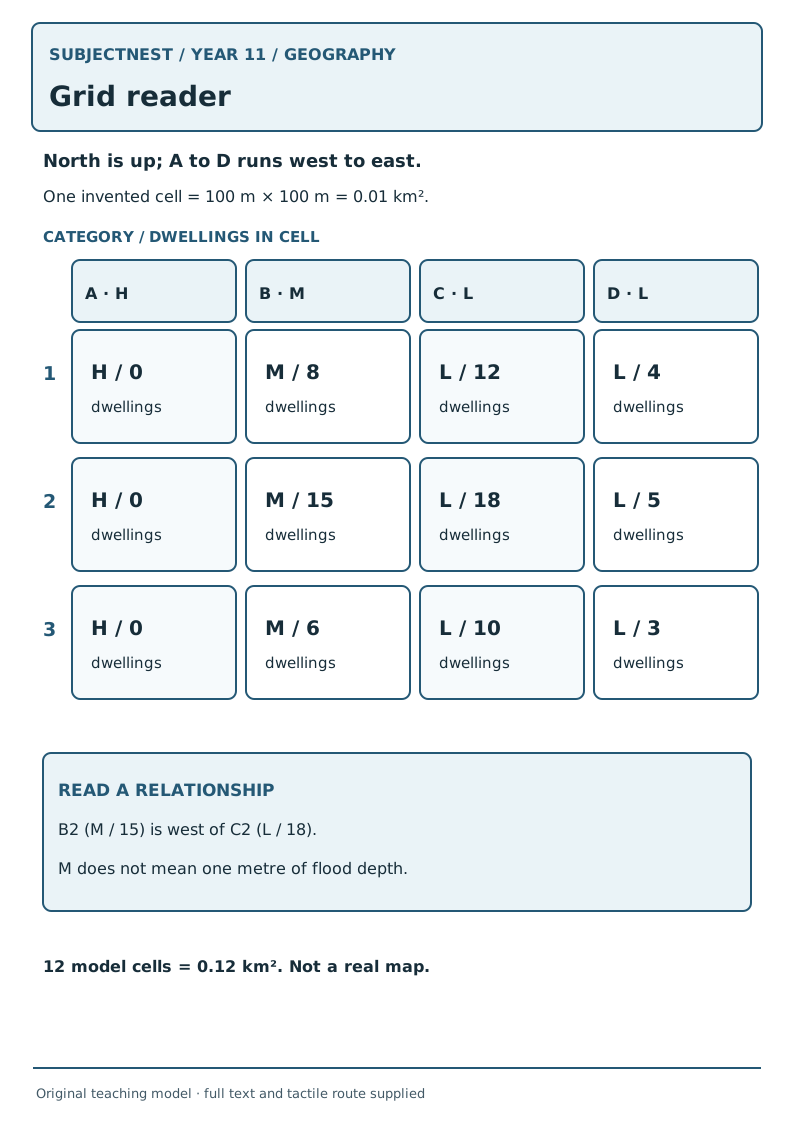
Grid reader
SVG · PDF. Reading order: North is up. Columns A/B/C/D run west to east. Rows 1/2/3 run north to south. Each invented cell is 100 m × 100 m = 0.01 km²; 12 cells = 0.12 km². The key: A is H, B is M, C and D are L; these are relative category labels, not water depths. Row 1 values: A1 H/0, B1 M/8, C1 L/12, D1 L/4 dwellings. Row 2: A2 H/0, B2 M/15, C2 L/18, D2 L/5. Row 3: A3 H/0, B3 M/6, C3 L/10, D3 L/3. B2 is west of C2. Tactile route: make a raised 3×4 array with embossed A–D headings across its top, 1–3 down its left, and a north arrow above. Put separate full-word category and dwelling-count tokens in each square. Have the learner move from B2 to C2 and explain west→east; never let texture alone encode category.
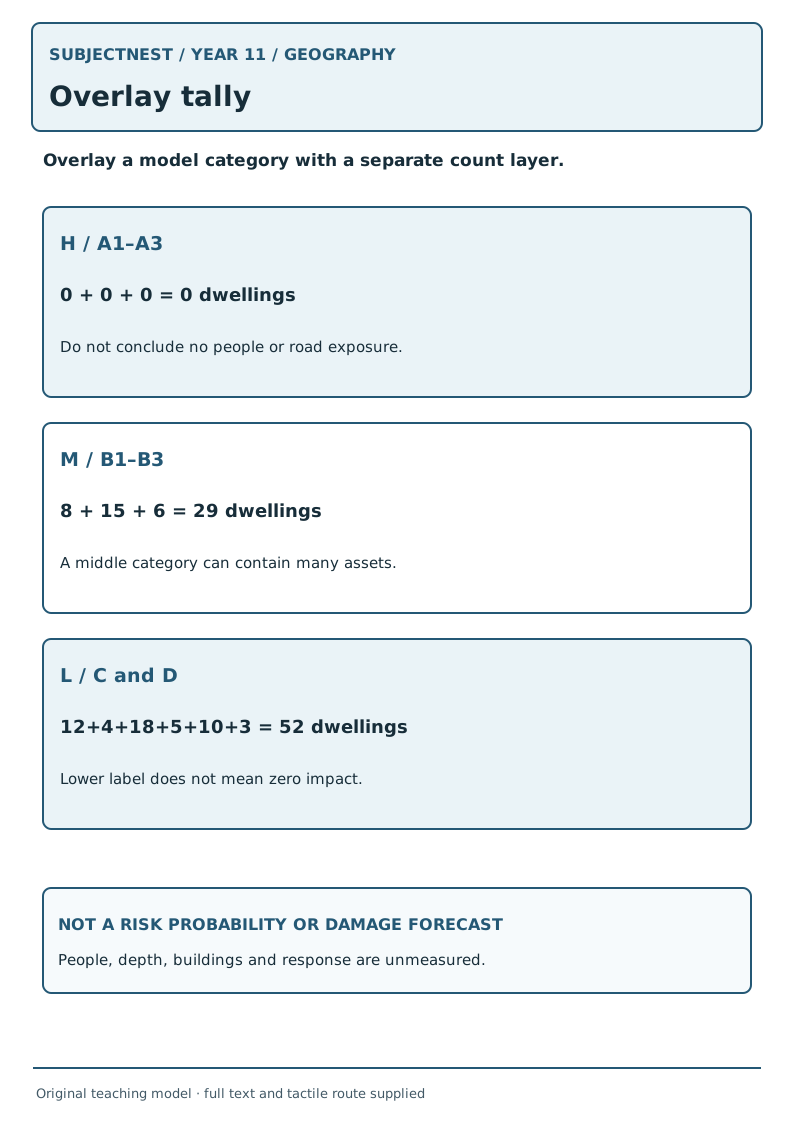
Overlay tally
SVG · PDF. Reading order: overlay the Card A category layer with the separate count layer. H/A1–A3: 0+0+0=0 dwellings, not necessarily no people or roads. M/B1–B3: 8+15+6=29 dwellings. L/C and D: 12+4+18+5+10+3=52 dwellings. These totals are not risk probabilities or damage forecasts. People, depth, buildings and response are unmeasured. Tactile route: three full-word H/M/L trays; move twelve coordinate-labelled count cards into the matching tray, total with counters, then attach a “not people or losses” label to the final table.
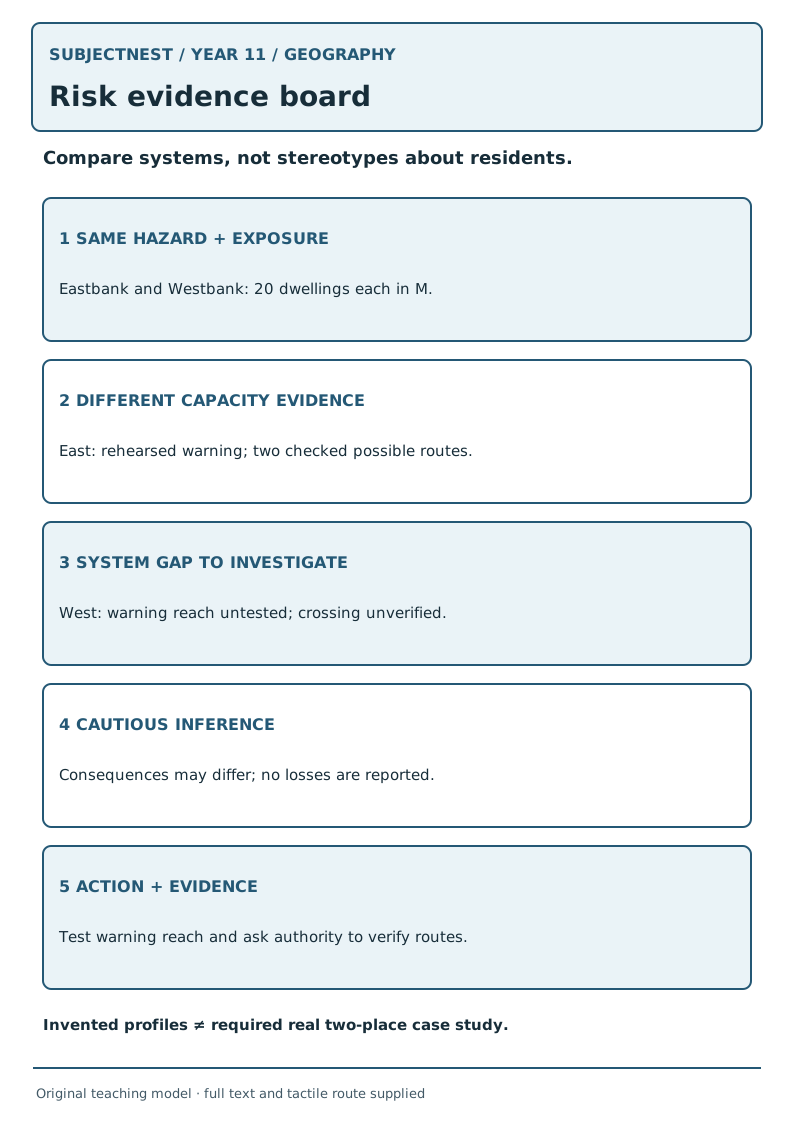
Risk evidence board
SVG · PDF. Reading order: 1 Same hazard/exposure — invented Eastbank and Westbank each have 20 dwellings in M. 2 Different capacity evidence — Eastbank has a rehearsed warning and two checked possible routes. 3 System gap to investigate — Westbank's warning reach is untested and crossing unverified. 4 Cautious inference — consequences may differ; no losses are reported. 5 Action plus evidence — test warning reach and ask a responsible authority to verify routes. The invented comparison is not QCAA's required real two-place case study. Tactile route: use five numbered full-word strips; pair strips 2/3 side by side after strip 1, then join them to inference and an action card with a raised connector. Ask which observation is missing before claiming either place is safe.
Access check: A reader who cannot see the SVG or PDF can reconstruct all coordinates, counts and distinctions from this page. A teacher using tactile cards must retain labels, not encode “risk” solely by colour/texture. A real local field lesson needs a separate consent, safety, authority and accessible-route plan.