Each session is 2 + 4 + 5 + 7 + 4 + 3 = 25 minutes. Prepare the invented cards, clean learner page, same-target daily routes, optional examples, print aids and, after student work, the public teacher key. The seven-minute response is an initial window; extend locally. All model locations and values are fictional; no route on a card is real emergency advice. Ask for reasoning from the supplied evidence rather than lived disaster experience.
Day 1 · Hazard is not an impact map
Target: distinguish a physical hazard process, a mapped hazard zone, exposed assets and an unsupported disaster claim. Prepare: Cards A/B and hazard-to-impact aid.
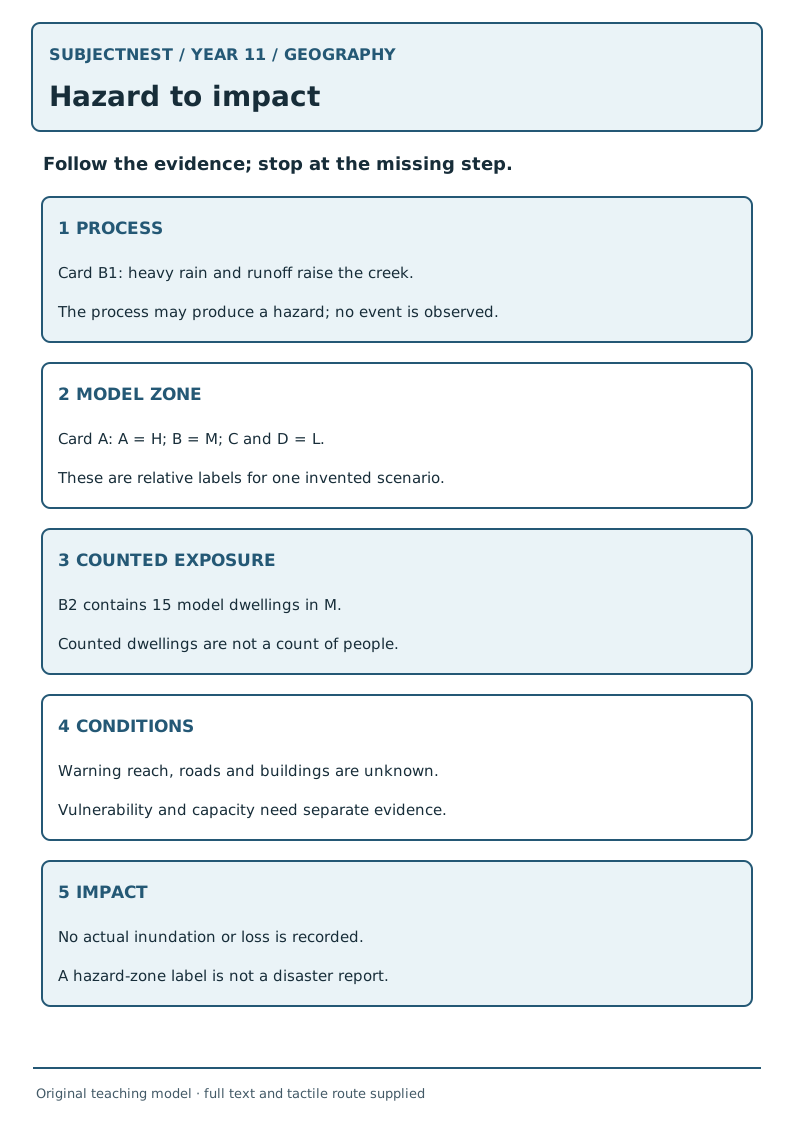
- Launch · 2 min. Show the claim “A1 is H; nobody lives in A1.” Ask which part the card supports and which part jumps beyond its dwelling count.
- Model · 4 min. B1 describes rain/runoff/creek overtopping; A labels potential model inundation. A's zero dwellings in A1 does not establish zero people, roads or ecosystems. No serious disruption has been recorded, so do not call this an observed disaster.
- Guided reading · 5 min. Pairs sort four statements: B1 process, A's M-zone band, 8 dwellings in B1 cell, “all residents evacuated.” Only the first three are supplied; the fourth is invented.
- Practice route · 7 min. Choose Day 1 route. Give one process→zone→exposure chain and one missing consequence datum for A.
- Audit · 4 min. A peer tries “higher hazard means most damage”; learner narrows it to this map's relative label and names missing vulnerability/capacity data.
- Exit · 3 min. “Does H with zero dwellings mean zero exposure?” Key: no; only zero counted dwellings in this teaching card.
Day 2 · Three process families
Target: explain one geological, one geomorphic and one atmospheric/surface interaction without treating the labels as exclusive. Prepare: Card B and hazard-to-impact aid.
- Launch · 2 min. Show “rain”, “loose slope material” and “fault slip.” Ask which begins inside Earth.
- Model · 4 min. Draw B3: accumulated stress→sudden fault slip→shaking. B1: heavy rain and runoff→creek overtopping. B2: saturated material on steep slope→downslope movement. Label cause, process and possible hazard separately.
- Guided reading · 5 min. Students put B1, B2, B3 under atmospheric/surface, geomorphic and geological headings, then add that rainfall can interact with the slope in B2. No specific disaster follows automatically.
- Practice route · 7 min. Choose Day 2 route. Explain two distinct causal chains and a cross-process interaction with the supplied wording.
- Audit · 4 min. Swap “all landslides are caused by rain” for “rainfall is one possible influence in this model”; check no earthquake probability is inferred for any named place.
- Exit · 3 min. “What process produces B3 shaking?” Key: imagined sudden slip on a fault, not rain.
Day 3 · Read the grid before making a claim
Target: use title, orientation, key, scale and cell references to describe a spatial pattern accurately. Prepare: Card A and grid reader.
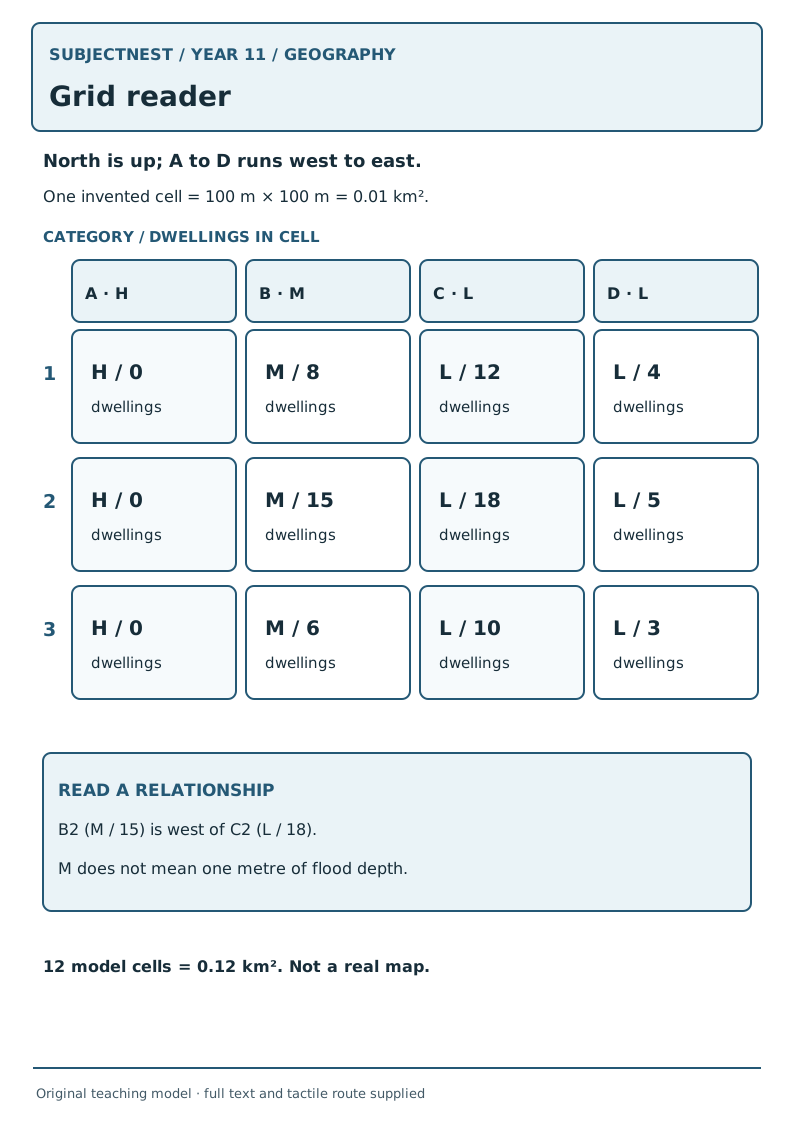
- Launch · 2 min. Point to B2. Ask whether it is west or east of C2 and whether the label is a measured depth.
- Model · 4 min. North is up; A→D runs west→east; row 1→3 north→south. B2 is M, immediately west of C2. One cell is 100 m by 100 m, so 0.01 km²; the 12-cell rectangle represents 0.12 km² in this model.
- Guided reading · 5 min. Students locate A3, C1 and D2 by coordinate; read the letter category and counted dwellings separately. Say “M cells form a north–south band” rather than “all of town floods.”
- Practice route · 7 min. Choose Day 3 route. Describe A's west–east category change with two cell references and one scale/legend caveat.
- Audit · 4 min. Partner reverses north/south or calls M “one metre”; learner uses the key to correct both.
- Exit · 3 min. “What is the area of one 100 m square cell?” Key: 10,000 m² = 0.01 km²; this does not create a real map scale.
Day 4 · Overlay hazard and exposure
Target: combine a category map and counts without presenting a count as risk probability. Prepare: Card A and overlay tally.
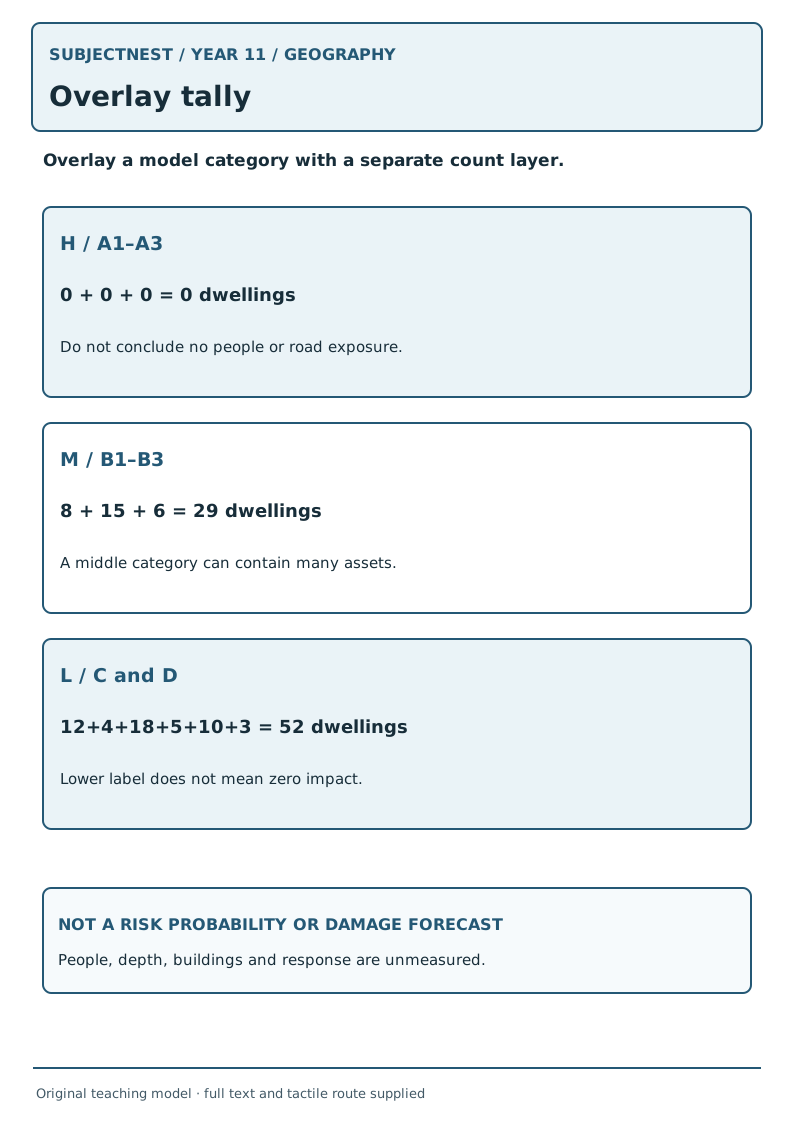
- Launch · 2 min. Ask whether the H band has the largest dwelling count just because H is the highest label.
- Model · 4 min. Total counted dwellings in M cells: 8+15+6=29. In H cells: 0. In L cells: 12+4+18+5+10+3=52. Write both layer names beside each total.
- Guided reading · 5 min. Discuss B2's 15 dwellings versus B1's 8 within the same M label; a settlement pattern changes exposure even where the classroom hazard class is constant. Ask what remains unknown about people, buildings and roads.
- Practice route · 7 min. Choose Day 4 route. Make a three-zone count table and one careful spatial inference.
- Audit · 4 min. Peer claims “29 houses will be destroyed” or “M has 29 residents”; learner corrects to 29 model dwellings located in cells labelled M under one invented scenario.
- Exit · 3 min. “Can we calculate actual damage from these counts?” Key: no; no actual event, depth, building condition or impact data.
Day 5 · Fresh public check A: Junction Park
Target: transfer process, grid and exposure reading to new File G. Prepare: File G alone and blank grid/overlay aids; the worked key is public but shown only after the first response.
- Launch · 2 min. Say the location is invented; ask for a bounded claim and its source cell.
- Source access · 4 min. Release File G and let learners inspect orientation, category key and counts; log any read-aloud or scribe support.
- Independent plan · 5 min. Learner locates two named cells and marks what is known versus missing.
- Independent response · 7 min. Choose Day 5 route; retain the first map description and calculation before content feedback.
- Self-audit · 4 min. Check units: a building count is not people; a relative model zone is not observed harm.
- Submit · 3 min. Collect the response/support log and use the separate public teacher key for next instruction. This is not a school examination.
Day 6 · Vulnerability and capacity change the story
Target: distinguish equal model hazard/exposure from different plausible vulnerability and capacity factors. Prepare: Card E and risk evidence board.
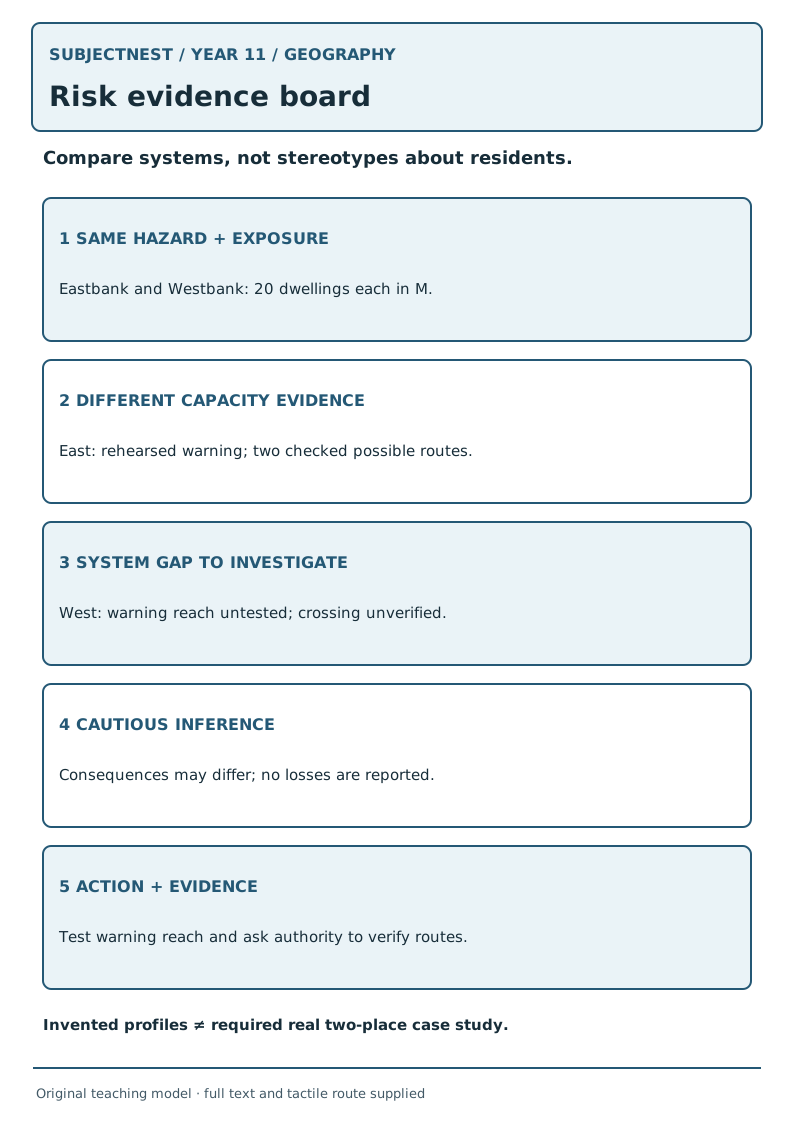
- Launch · 2 min. Both invented neighbourhoods have 20 dwellings in M. Ask whether equal counts prove equal consequences.
- Model · 4 min. Eastbank has rehearsed warning reach and two checked possible routes; Westbank has untested warning reach and one unverified crossing. State a conditional capacity difference, not a ranked real-world disaster forecast.
- Guided reading · 5 min. Distinguish hazard label, exposure count, vulnerability questions (for example building condition and dependence on a crossing) and capacity (warning network/checked route). No resident characteristics are assumed.
- Practice route · 7 min. Choose Day 6 route. Write one same factor, two different factors and two pieces of information needed to test implications.
- Audit · 4 min. A peer says “Westbank people are less prepared”; learner replaces a judgement about people with the exact system evidence given: warning reach untested.
- Exit · 3 min. “Can a dwelling tally alone determine risk?” Key: no; threat, who/what is exposed, vulnerability and capacity need evidence.
Day 7 · Time characteristics and uncertainty
Target: compare onset and duration without assuming either alone decides severity or frequency. Prepare: Card D and hazard-to-impact aid.
- Launch · 2 min. Compare D1's 20-minute lead and D2's 18-hour lead. Ask whether they need identical communication timing.
- Model · 4 min. D1 onset-to-impact 20 minutes, duration 2 hours; D2 18 hours, 3 days. D3 shaking is 40 seconds in this made-up event. This says nothing about how often any occurs or how many people are affected.
- Guided reading · 5 min. Students order the three by stated duration, then separately ask what preparedness/time information is missing. A 40-second event can still have serious effects.
- Practice route · 7 min. Choose Day 7 route. Compare D1 and D2 on two dimensions and make a conditional communication proposal with a limit.
- Audit · 4 min. Peer calls D1 “one-in-20-year flooding” or D3 “safe because brief”; learner strikes both unsupported claims.
- Exit · 3 min. “Can three invented timelines tell us event frequency?” Key: no; frequency needs an appropriate record/model.
Day 8 · Spatial access beyond the water's edge
Target: infer a possible network effect from a spatial relationship, then identify the data needed before proposing a real route. Prepare: Card C and grid reader.
- Launch · 2 min. In the scenario B2 bridge is closed; ask whether a clinic at lower-labelled C2 is necessarily reachable from the west.
- Model · 4 min. Place library C1, clinic C2, workshop D2, interchange B3. B2 is the only supplied crossing. A western traveller's access may fail even if C2 is lower model inundation. Never tell a learner to use an unverified route.
- Guided reading · 5 min. Ask what a current road authority map, accessibility information, timing and emergency direction would add. Separate facility exposure from network access.
- Practice route · 7 min. Choose Day 8 route. Draw or describe the network dependency and a cautious school/clinic/transport communication action, conditional on authority verification.
- Audit · 4 min. Partner invents an eastern crossing; learner points out none is given and holds the route claim.
- Exit · 3 min. “What does the B2 closure establish?” Key: the only supplied west-to-east crossing is closed in this invented scenario; a real safe route cannot be concluded.
Day 9 · From map evidence to a proportionate action
Target: propose one action that follows from bounded spatial evidence and recognise where an authentic two-place study is still required. Prepare: Cards E/F and risk evidence board.
- Launch · 2 min. Card F has 30 western-route learners out of 52 total. Ask which number a western crossing closure directly affects in the brief.
- Model · 4 min. 30 are linked to the western route, not necessarily harmed. Option 2 proposes accessible multimode information and verification by the transport authority; no alternative safe route is established. Connect proposed action to the access issue, with a checkable next evidence step.
- Guided reading · 5 min. Revisit E: same scenario/exposure, different warning and crossing information. Explain why this invented comparison cannot stand in for QCAA's two real locations in differently developed countries.
- Practice route · 7 min. Choose Day 9 route. State spatial evidence, conditional impact, action, responsible verifier and limitation for F.
- Audit · 4 min. Peer says “Option 2 guarantees access”; learner changes this to a proposal to test and verify, then asks how the message reaches people who need it.
- Exit · 3 min. “What is still needed for QCAA's Topic 1 case study?” Key: a real hazard at two real contrasting locations, sourced spatial/exposure/vulnerability data and defensible comparison/action.
Day 10 · Fresh public check B: Quarry Edge
Target: transfer process, spatial interpretation, vulnerability/capacity and a bounded action to new File H. Prepare: File H alone, blank risk board and support log.
- Launch · 2 min. Say the slope and settlement are fictional; no school or travel decision follows from this case.
- Source access · 4 min. Release File H without its public worked key; let learners inspect the cross section and table.
- Independent plan · 5 min. Learner identifies the process, the exposed site, a capacity question and a possible action.
- Independent response · 7 min. Choose Day 10 route and preserve first reasoning/diagram before prompts.
- Self-audit · 4 min. Check directional language, correct units and whether a model possibility was called proven harm.
- Submit · 3 min. Collect response/support log; use the public teacher key for next instruction. No QCAA unit judgement follows.
SubjectNest original teacher scripts © NeuroForgeIO Pty Ltd 2026, CC BY 4.0.