Target: combine a category map and counts without presenting a count as risk probability. Prepare: Card A and overlay tally.
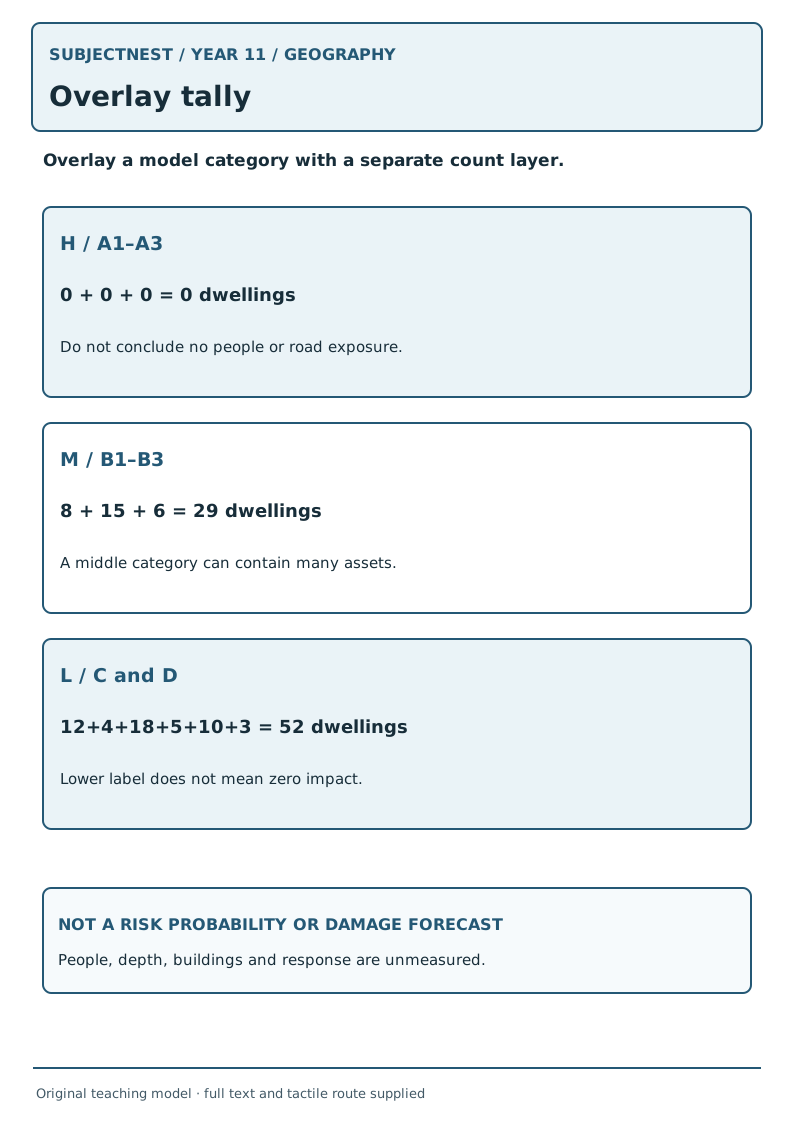
- Launch · 2 min. Ask whether the H band has the largest dwelling count just because H is the highest label.
- Model · 4 min. Total counted dwellings in M cells: 8+15+6=29. In H cells: 0. In L cells: 12+4+18+5+10+3=52. Write both layer names beside each total.
- Guided reading · 5 min. Discuss B2's 15 dwellings versus B1's 8 within the same M label; a settlement pattern changes exposure even where the classroom hazard class is constant. Ask what remains unknown about people, buildings and roads.
- Practice route · 7 min. Choose Day 4 route. Make a three-zone count table and one careful spatial inference.
- Audit · 4 min. Peer claims “29 houses will be destroyed” or “M has 29 residents”; learner corrects to 29 model dwellings located in cells labelled M under one invented scenario.
- Exit · 3 min. “Can we calculate actual damage from these counts?” Key: no; no actual event, depth, building condition or impact data.