All numbers below are invented classroom data, not observations, quotes, prices or financial advice. This is the teacher master and includes answers plus a fresh Day 10 item: do not distribute the whole file before assessment. Give learners the separate student data cards for Days 1–9. The same contexts are used in the English reading set and integrated guides. Students can work on paper using the scatterplot frame and cost comparison board, or with their plain-text equivalents. No account or screen is required. A digital graph may be used locally as an optional check.
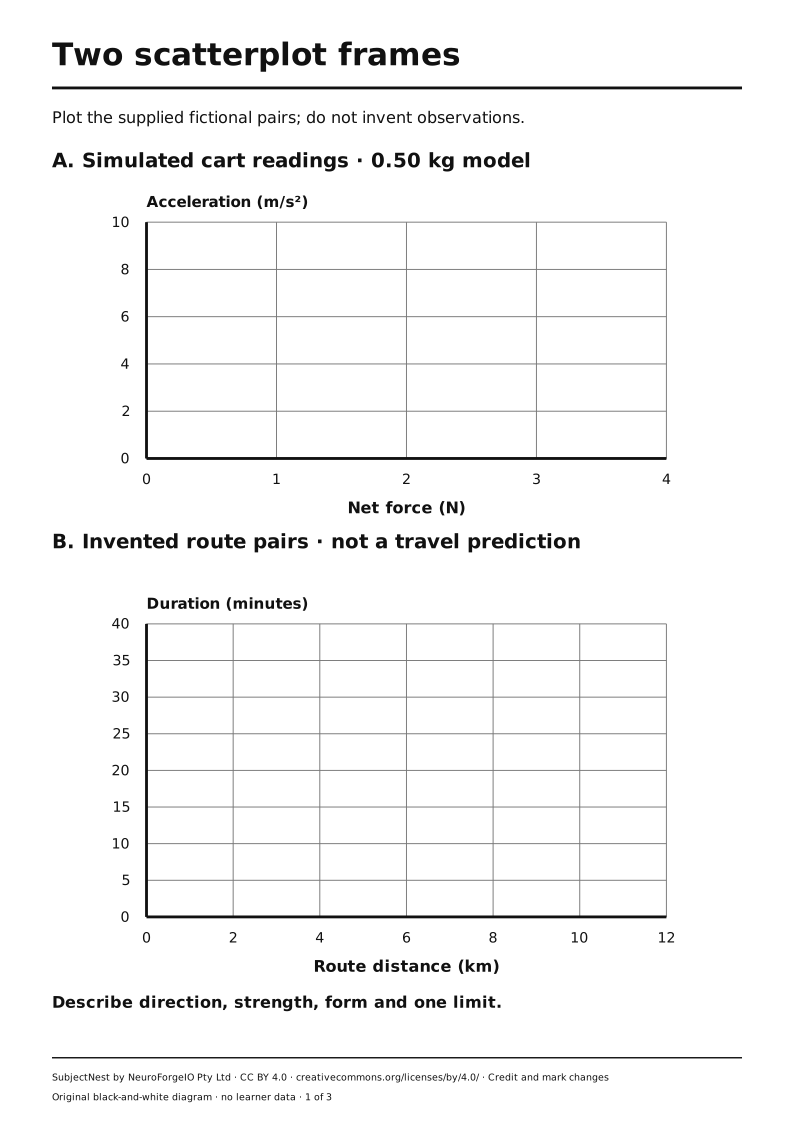
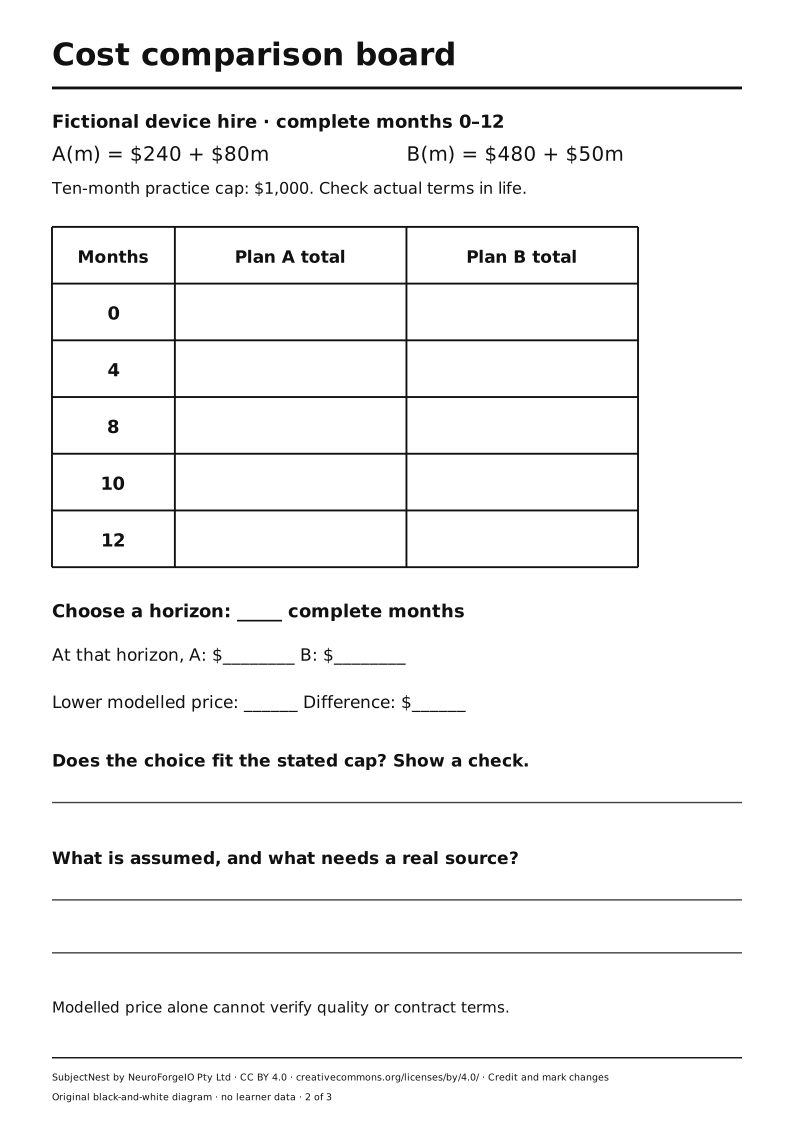
Table A: model cart (fictional simulated readings)
A 0.50 kg model cart is assigned eight simulated trials. The listed force is net force, not an unmeasured push. Accelerations vary slightly around the ideal model a = F_net / m. No experiment was actually conducted; the variation was authored to allow discussion of measurements, repeated trials and limits.
| Trial | Net force (N) | Simulated acceleration (m/s²) |
|---|---|---|
| 1 | 1 | 1.8 |
| 2 | 1 | 2.1 |
| 3 | 2 | 3.8 |
| 4 | 2 | 4.2 |
| 5 | 3 | 5.9 |
| 6 | 3 | 6.2 |
| 7 | 4 | 7.8 |
| 8 | 4 | 8.1 |
Plot force on horizontal axis from 0–4 N and acceleration vertically from 0–10 m/s², matching the printable frame and learner card. The pattern is strong positive, approximately linear for this constructed set. Paired averages are 1.95, 4.00, 6.05 and 7.95 m/s², versus ideal 2, 4, 6 and 8 m/s². A scatterplot and an association statement do not by themselves establish that a wheel finish caused a change. Force and mass would need to be held comparable for a finish comparison, with a valid local method. No wheel-finish comparison data are supplied.
Table B: fictional travel planning transfer
Six invented route-distance/duration pairs, in km and minutes: (2,7), (4,13), (6,18), (8,26), (10,31), (12,35). They show a positive roughly linear association in this invented set. Route, stops and traffic are not specified; do not make a real transport estimate. A text-only comparison can order pairs and describe direction without seeing the plotted dots.
Table C: fictional 10-month device-hire brief
An adult fictional household is comparing two simplified month-to-month device-hire plans for study and creative work. Both plans are assumed to meet the same fictional minimum access, safety and service requirements; that assumption would need checking in life. There is no exit fee in this simplified exercise. Monthly payments are due for each complete month; m is a whole number from 0 to 12. A $1,000 cap for the first 10 months is a practice constraint, not advice about anyone's budget.
| Plan | Setup cost | Monthly cost | Total model |
|---|---|---|---|
| A | $240 | $80 | A(m)=240+80m |
| B | $480 | $50 | B(m)=480+50m |
Key values: at month 0, A $240 and B $480; at month 4, A $560 and B $680; at month 8, both $880; at month 10, A $1,040, B $980; at month 12, A $1,200, B $1,080. Equality: 240+80m=480+50m, so 30m=240, m=8. A is cheaper for whole months 0–7; tie at 8; B cheaper for 9–12. Under $1,000, A permits at most 9 complete months (cost $960) and B at most 10 (cost $980), within the 0–12 model. At the stated 10-month horizon, B fits the cap and A does not. The model omits taxes, actual terms, device performance, repair outcomes, energy use and legal rights. A real choice needs current, verified sources and advice appropriate to the person.
New check data (do not model before Day 10)
Two different fictional plans for an invented creative device: X(m)=180+90m, Y(m)=420+60m, with whole months 0–12. Equality at 180+90m=420+60m → 30m=240 → 8 months, cost $900. At 10 months X $1,080, Y $1,020. With a $1,000 practice cap at 10 months, neither fits. At month 9, X $990 and Y $960, both fit. Students should state the model's missing conditions rather than present it as a real offer.
Access, verification and rights
Use a ruler or grid, large-print coordinates, raised axes with pins/cord placed by an adult, typed tables, speech/AAC, or partner-operated plotting under the learner's direction. For equations, a student can dictate the inverse steps and verify by substitution. Record the support supplied. Do not classify learners by a fixed “learning style”. An inaccessible graph is not evidence of weak statistical reasoning.
Original fictional data, examples and explanatory text © NeuroForgeIO Pty Ltd 2026, SubjectNest, CC BY 4.0. Credit the source, link the licence and indicate changes. The ACARA descriptions retain separate attribution and terms.