Teach with learner-facing data cards, dated check cards, the teacher notes and answers, key, scatterplot frame and cost board. Keep the teacher master and fresh Day 10 item out of learner copies until the check. The contexts are fictional. Six numbered phases in each lesson total 25 minutes. A code means partial work on that Year 10 Australian Curriculum v9 description. Everyone attempts a brief exit; the teacher observes a rotating 2–3 focus learners and schedules later private checks where independence remains unclear. Give accessible coordinates/text whenever a visual graph is used.
Day 1 — What a pair of numbers can show
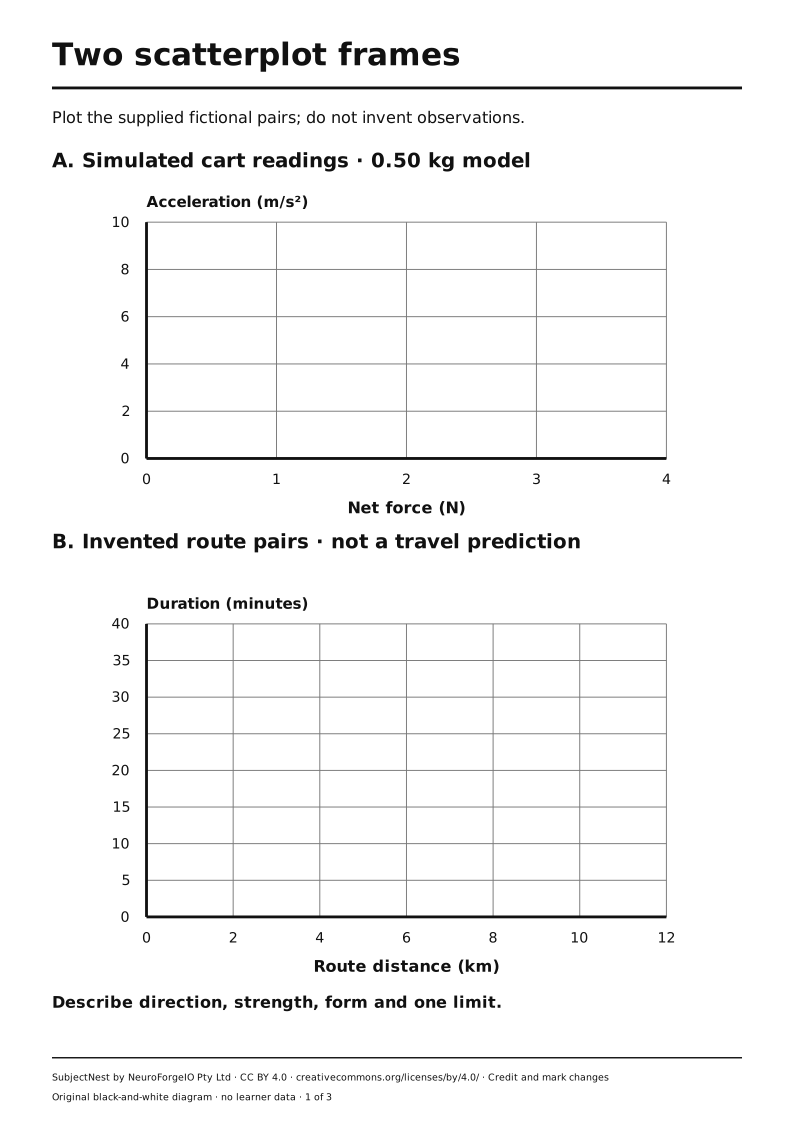
Codes: AC9M10ST03. Goal: identify paired variables, units and a plausible association without claiming cause. Prepare: Table B and blank scatterplot frame.
- Launch · 2 min. Say: “These six routes are invented. If a route is longer, is its listed travel time usually longer?” Ask which two quantities form each pair.
- Model · 5 min. Plot
(2,7)and(4,13)with distance in km on the horizontal axis and duration in minutes vertically. Name the ordered-pair convention and units. Make the axes start at zero on this frame. - Guide · 6 min. Pairs plot
(6,18)and(8,26)then read back the coordinates. Ask why exchanging axes would change the question but not the source pairs. - Complete and interpret · 7 min. Students add
(10,31)and(12,35), then describe positive, roughly linear association in this invented set. A learner may describe the ordered pairs in text instead of drawing. - Check a leap · 3 min. Ask: “Can this plot guarantee a real 12 km trip takes 35 minutes?” No: the values are fictional and stops/traffic are unspecified. Discuss what the graph can and cannot support.
- Exit · 2 min. Everyone labels the variables and writes “as distance increases, listed duration generally increases” with the fictional scope. Sample focus explanations.
Access: raised or large-grid axes, coordinate list, partner operated marking or screen-reader table. The construct is association, not eyesight or pen control.
Day 2 — Plot the repeated cart trials
Codes: AC9M10ST03. Goal: construct and read a scatterplot with repeats. Prepare: learner Table A, frame; note that accelerations are simulated.
- Set scale · 2 min. Ask: “What must the axes include?” Force 0–4 N horizontally; acceleration 0–10 m/s² vertically, matching the printable frame.
- Model · 5 min. Plot trials 1 and 2 at
x=1withy=1.8and2.1. Say two trials may share an x-value without being the same point. - Guide · 6 min. Students plot forces 2 and 3 with a partner; partner checks each value against the table, including decimals.
- Complete · 7 min. Independently add forces 4, label units and circle one pair of repeated force trials. If using digital plotting, compare with a hand or text version and keep all data local.
- Read · 3 min. Ask: “At 4 N, what two simulated accelerations are listed?” 7.8 and 8.1 m/s². Do not read 8.1 as speed.
- Exit · 2 min. Everyone states coordinates for trial 5:
(3 N, 5.9 m/s²)and names which axis carries force.
Access: tactile dots, high-contrast marked axes, typed coordinate table, partner at learner direction. Record whether plotting or reading required a prompt.
Day 3 — Describe a pattern precisely
Codes: AC9M10ST03. Goal: discuss direction, strength and linearity in context. Prepare: completed Table A plot and a four-column vocabulary strip.
- Notice · 2 min. Ask for a first description, then say: “We will make it specific enough that another reader could test it.”
- Model · 5 min. As net force rises from 1 to 4 N, simulated acceleration rises; points cluster near a straight upward path. Call it strong positive and approximately linear in this constructed set. Do not say “perfect”.
- Guide averages · 6 min. At 1 N calculate
(1.8+2.1)/2=1.95; at 2 N(3.8+4.2)/2=4.0. Compare with ideala=F/0.5, which gives 2 and 4. Distinguish simulated readings from theoretical values. - Choose and justify · 7 min. Students either compute averages at 3 and 4 N (6.05, 7.95) or explain in words how repeats vary. Then make one accurate association sentence with both units and scope.
- Counterclaim · 3 min. Show “The finish on the wheels caused the trend.” Ask what is missing. No finish comparison is in Table A; association with net force does not test that claim.
- Exit · 2 min. Everyone states direction, approximate form and one limitation. Teacher samples focus learners' independent wording.
Access: four vocabulary cards, text readout of pairs, calculator only after a shown average method if an access plan calls for it.
Day 4 — A headline can select the wrong comparison
Codes: AC9M10ST01, AC9M10ST03. Goal: audit a numerical claim against the original dataset and identify a biased selection. Prepare: fictional media post and learner Table A.
- Read · 2 min. Display the source's actual “Silver finish makes cart four times faster!” and ask what comparison the headline invites.
- Model · 5 min. Locate 8.1 from a 4 N trial and 1.8 from a 1 N trial. Their ratio is 4.5, not exactly four; force also changed. The readings are acceleration, not speed. Say that unmatched conditions and the absent finish variable cannot isolate a wheel-finish effect.
- Guide · 6 min. Pairs list what would need to be comparable to test finish: mass, net force, track/method and repeat procedure. The supplied table has no finish variable.
- Repair · 7 min. Students write a scoped alternative caption: “In eight fictional simulated trials of a 0.50 kg cart, acceleration increased as net force increased.” Add “approximately” if describing a linear trend. No finish conclusion.
- Ethics · 3 min. Ask why choosing only high/low values could matter if readers used it to decide on equipment. Require exact source and uncertainty, not a shaming judgement of the fictional writer.
- Exit · 2 min. Everyone names one numerical fact and one unsupported inference in the headline.
Access: read both headline and table aloud, allow highlighting or text notes, AAC claim/evidence/limit cards.
Day 5 — Check A: scatterplot and claim
Codes: AC9M10ST01, AC9M10ST03. Goal: sample independent representation and critique. Prepare: learner Check A, teacher key; Table B values on a clean sheet.
- Orient · 2 min. Say: “A valid conclusion names the data it comes from and what remains unknown.”
- Rehearse · 5 min. Together place one different example pair
(3,9)on a fresh axis and recall units. This pair is practice only, not part of either dataset. - Independent plot · 6 min. Learners plot four supplied Table B pairs
(2,7),(4,13),(8,26),(12,35)or provide a precise text-coordinate description. - Independent reading · 7 min. They describe direction/form and repair “Every real 12 km trip takes exactly 35 minutes.” Teacher collects before feedback.
- Feedback · 3 min. Respond to actual work: “Your coordinates are sound; add the minutes unit,” or “Your claim reaches beyond the fictional set; name its scope.” Do not turn the check into a class ranking.
- Close · 2 min. Everyone records one graph choice that helped; teacher schedules an unseen transfer item for an uncertain learner.
Access: exact adult reading of the prompt, large/tactile axes or text list, quiet response. Note any cue supplied.
Day 6 — Turn a plan into an equation
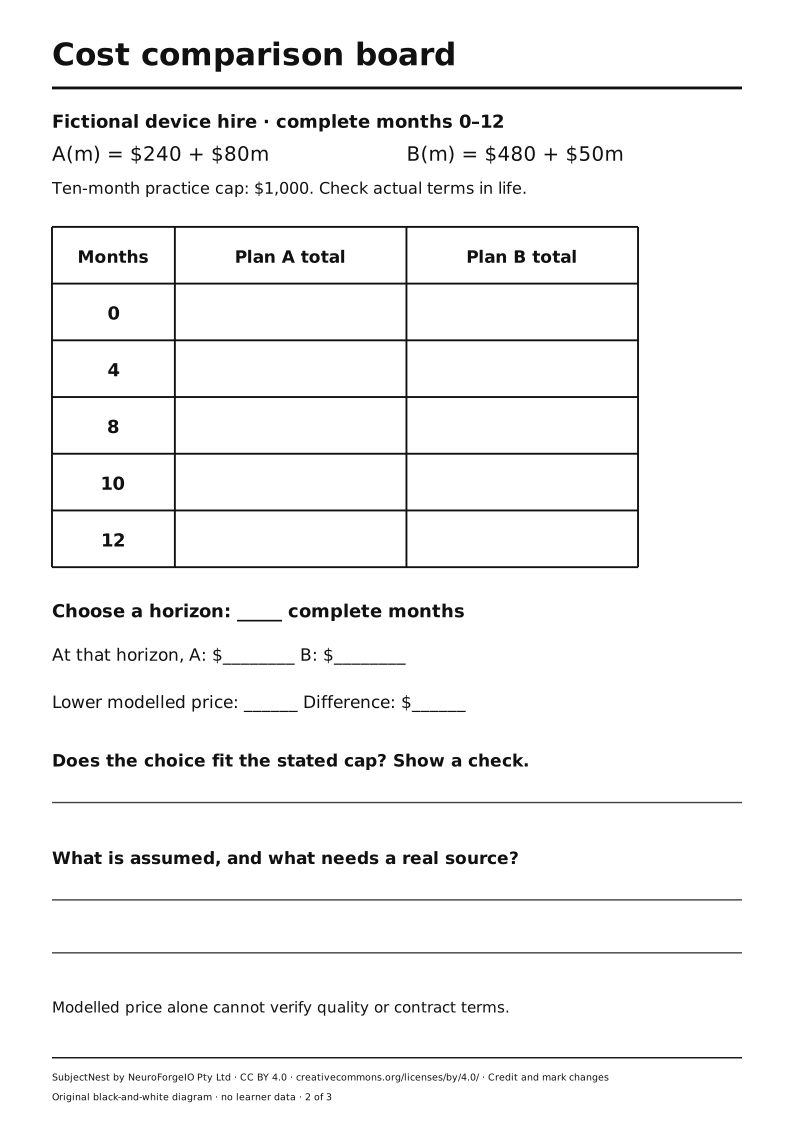
Codes: AC9M10A04. Goal: formulate two linear cost models and say what their terms mean. Prepare: fictional device-hire brief and cost board.
- Context · 2 min. “This is an invented adult household choice. We compare simplified totals; no one will disclose personal finances or make a purchase.”
- Model · 5 min. Let
mbe complete months.A(m)=240+80m: $240 setup at m=0, then $80 per month. Write the parallelB(m)=480+50mwith units. - Guide values · 6 min. Calculate at m=4: A $560, B $680. Ask why multiplying setup by four would be wrong.
- Represent · 7 min. Learners fill a small table for m=0,4,8,10. Use the cost board or text table. Check A/B at 8 both $880 but with different cost structures.
- Assumptions · 3 min. Name one omitted real condition: actual contract, device quality, repair outcome or exit terms. Fixed monthly increase makes these linear within the model; real total cost might not be.
- Exit · 2 min. Everyone explains the 50 and 480 in
B(m)and gives B(4) = $680.
Access: money counters, large text, typed formula, speech/AAC explanation. Do not require a home-budget story from the learner.
Day 7 — Solve and read the crossing point
Codes: AC9M10A02, AC9M10A04. Goal: solve a pair of linear equations and interpret the graphical intersection. Prepare: cost models and axes 0–12 months, $0–$1,300.
- Predict · 2 min. “Plan A starts cheaper but rises faster. Could the totals meet?” Ask for a reasoned guess.
- Model algebra · 5 min. Set
240+80m=480+50m. Subtract50mand $240:30m=240, so m=8. Substitute: both $880. - Graph check · 6 min. Plot each plan at m=0 and m=8; straight lines meet at
(8 months, $880). Discuss that the intersection means equal modelled cost, not equal service quality. - Independent comparison · 7 min. Compare m=6: A $720, B $780, so A cheaper by $60. Compare m=10: A $1,040, B $980, so B cheaper by $60. Ask why ordering reverses.
- Error check · 3 min. Show
30m=240 → m=30/240. Repair the inverse operation and substitute to test 8. - Exit · 2 min. Everyone states the crossing coordinate with both units and one model limit.
Access: tactile crossing lines or paired value table; demonstrate equality by substitution without demanding visual graph reading.
Day 8 — A budget makes an inequality
Codes: AC9M10A02, AC9M10A04. Goal: solve and interpret linear inequalities for whole-month commitments. Prepare: $1,000 practice cap, cost models.
- Ask · 2 min. “If the fictional cap is $1,000, does a solution of 9.5 months mean 9.5 payments are possible?” No: the model uses complete months.
- Model A · 5 min.
240+80m ≤ 1000→80m ≤ 760→m ≤ 9.5; with whole months 0–12, maximum 9. Check A(9)=$960 and A(10)=$1,040. - Guide B · 6 min.
480+50m ≤ 1000→50m ≤ 520→m ≤ 10.4; maximum 10. Check B(10)=$980 and B(11)=$1,030. - Apply · 7 min. A fictional planner needs 10 complete months. Students decide which plan fits the stated cap: B only, within this model. They must say what the calculation does not judge.
- Challenge · 3 min. Ask whether A at m=9 and B at m=10 is a fair price-only comparison for the same service duration. No; compare the same horizon.
- Exit · 2 min. Everyone writes A's maximum whole months and the pair of values that check the boundary.
Access: number-line inequality and table route; calculator as check after symbolic steps; oral explanation of whole-month boundary accepted.
Day 9 — Change a model when a condition changes
Codes: AC9M10A04, AC9M10A02. Goal: evaluate a model's assumptions and test a change without silently moving the goalposts. Prepare: cost board, brief.
- Set problem · 2 min. “Suppose the household now needs only four months. Is B still the price-only choice?”
- Recall · 5 min. Calculate A(4)=$560 and B(4)=$680. Explain why A is cheaper for four months while B is cheaper at ten.
- Model review · 6 min. The two formulas increase by fixed amounts each month, so a linear model fits the invented price rules. A percentage fee each month would require a different growth model; none is stated here.
- Modify · 7 min. Give an invented variation: B's setup is reduced by $60 to $420 while monthly cost stays $50. Write
B_new(m)=420+50m; solve equality with A:240+80m=420+50m→m=6, total $720. Compare with original crossing at 8. - Evaluate · 3 min. Ask whether the reduced setup proves B has better value. No: the exercise omits service and rights; price is only one criterion.
- Exit · 2 min. Everyone states one changed assumption, new crossing and one real-world question to verify.
Access: value table before algebra, paired line model, typed or dictated reasoning. Mark which representation revealed the change.
Day 10 — Check B: independent model and audit
Codes: AC9M10A02, AC9M10A04, AC9M10ST01. Goal: independently formulate, solve and qualify a new fictional comparison. Prepare: learner Check B and teacher key; give the new X/Y data only on Day 10.
- Orient · 2 min. “Use a model and substitution check. A correct number without a sensible interpretation is unfinished.”
- Read · 5 min. Supply X $180 setup+$90/month and Y $420 setup+$60/month, whole months 0–12; $1,000 cap at ten months. Adult may read the exact prompt without explaining strategy.
- Solve · 6 min. Students write both equations and find the crossing. Teacher does not announce the answer.
- Apply · 7 min. Students calculate both at ten months, decide whether either fits $1,000, and name one missing condition before a real decision. Collect work before class correction.
- Self-check · 3 min. Learners substitute the crossing into both models and label units; they may repair an error, showing the revision.
- Close · 2 min. Everyone submits a written, tactile, spoken/AAC or typed solution. Teacher uses the keyed next moves and marks independent/prompted/not yet observed.
Access: accessible text brief, large table, quiet space, tool use documented. Later individual recheck if a scaffold hid algebraic reasoning.
Reuse: Original SubjectNest lessons and fictional models © NeuroForgeIO Pty Ltd 2026, CC BY 4.0. Credit source/licence and mark changes. ACARA codes retain separate terms.